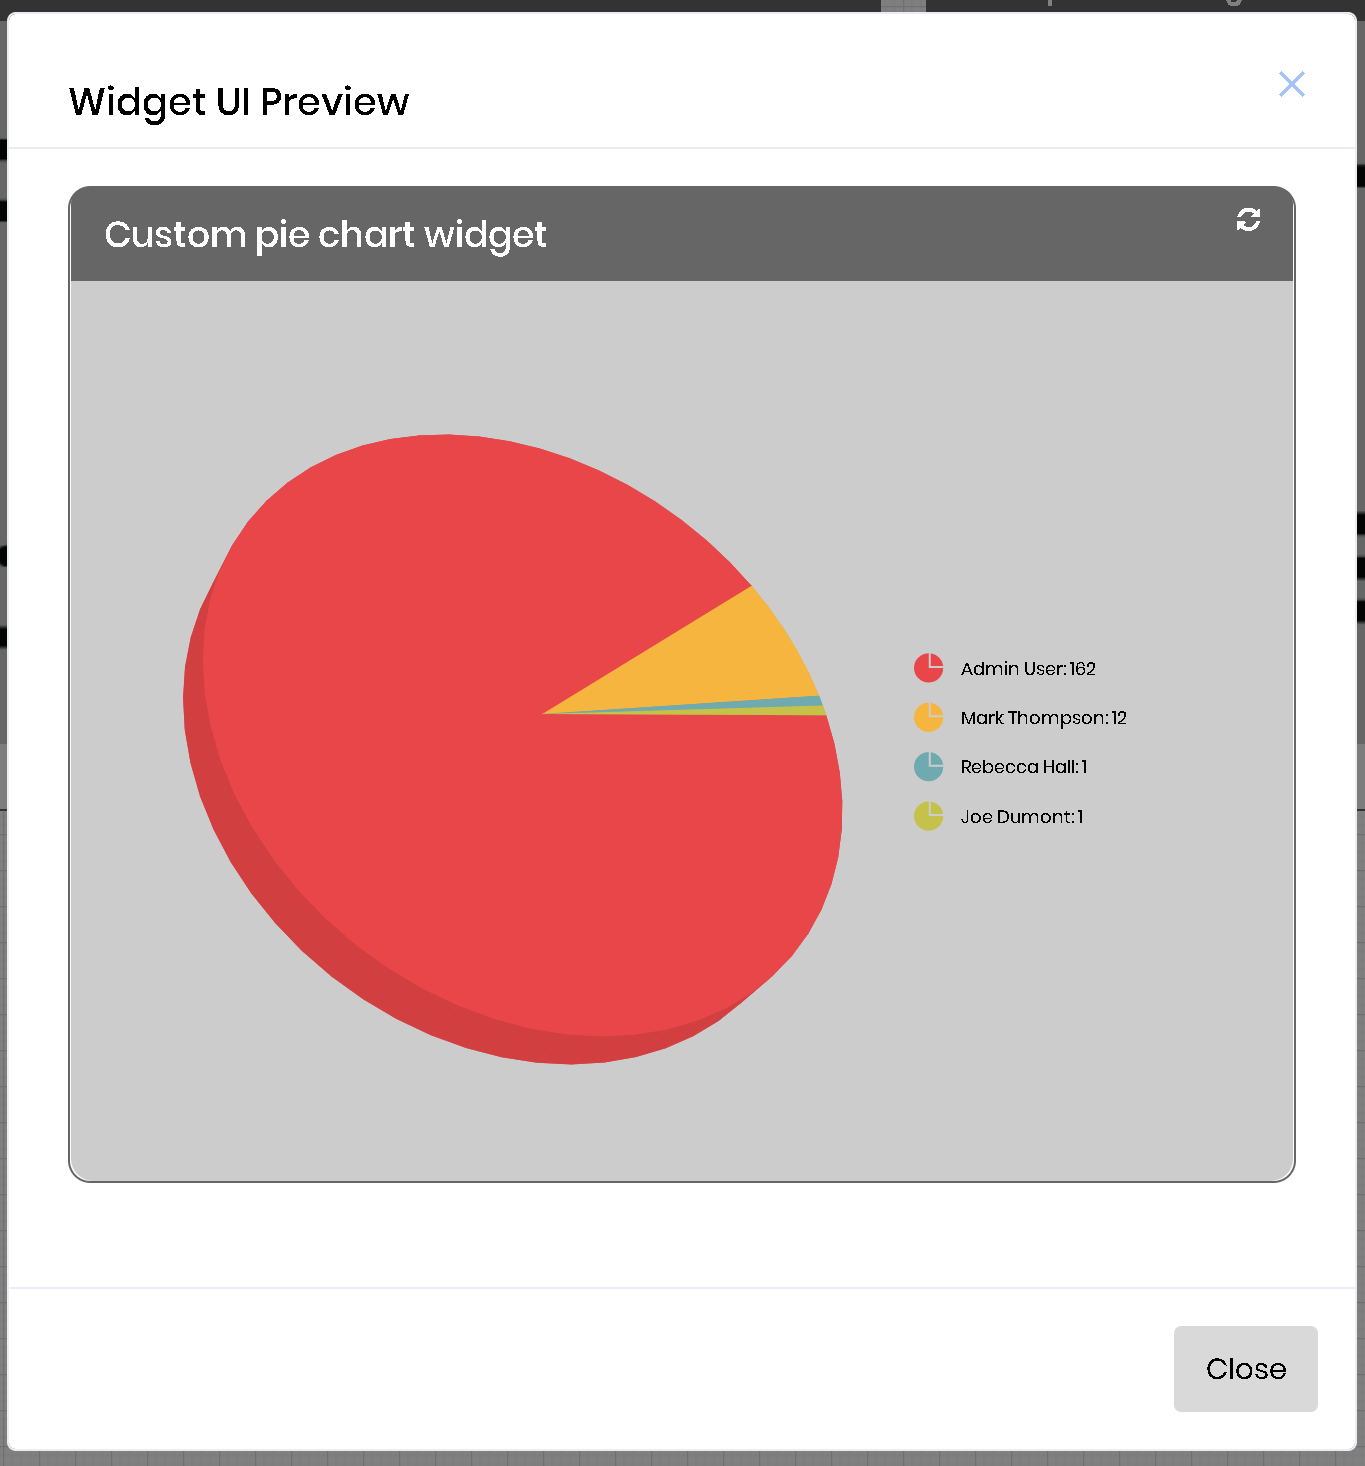
The custom pie chart widget is able to bring data using a database connection and a SQL query and display a pie chart from the resulting data.

Once you drag a the custom pie chart to the dashboard designer canvas, hover over the widget and click the edit icon. Edit icon should display the following configuration screen for the widget:
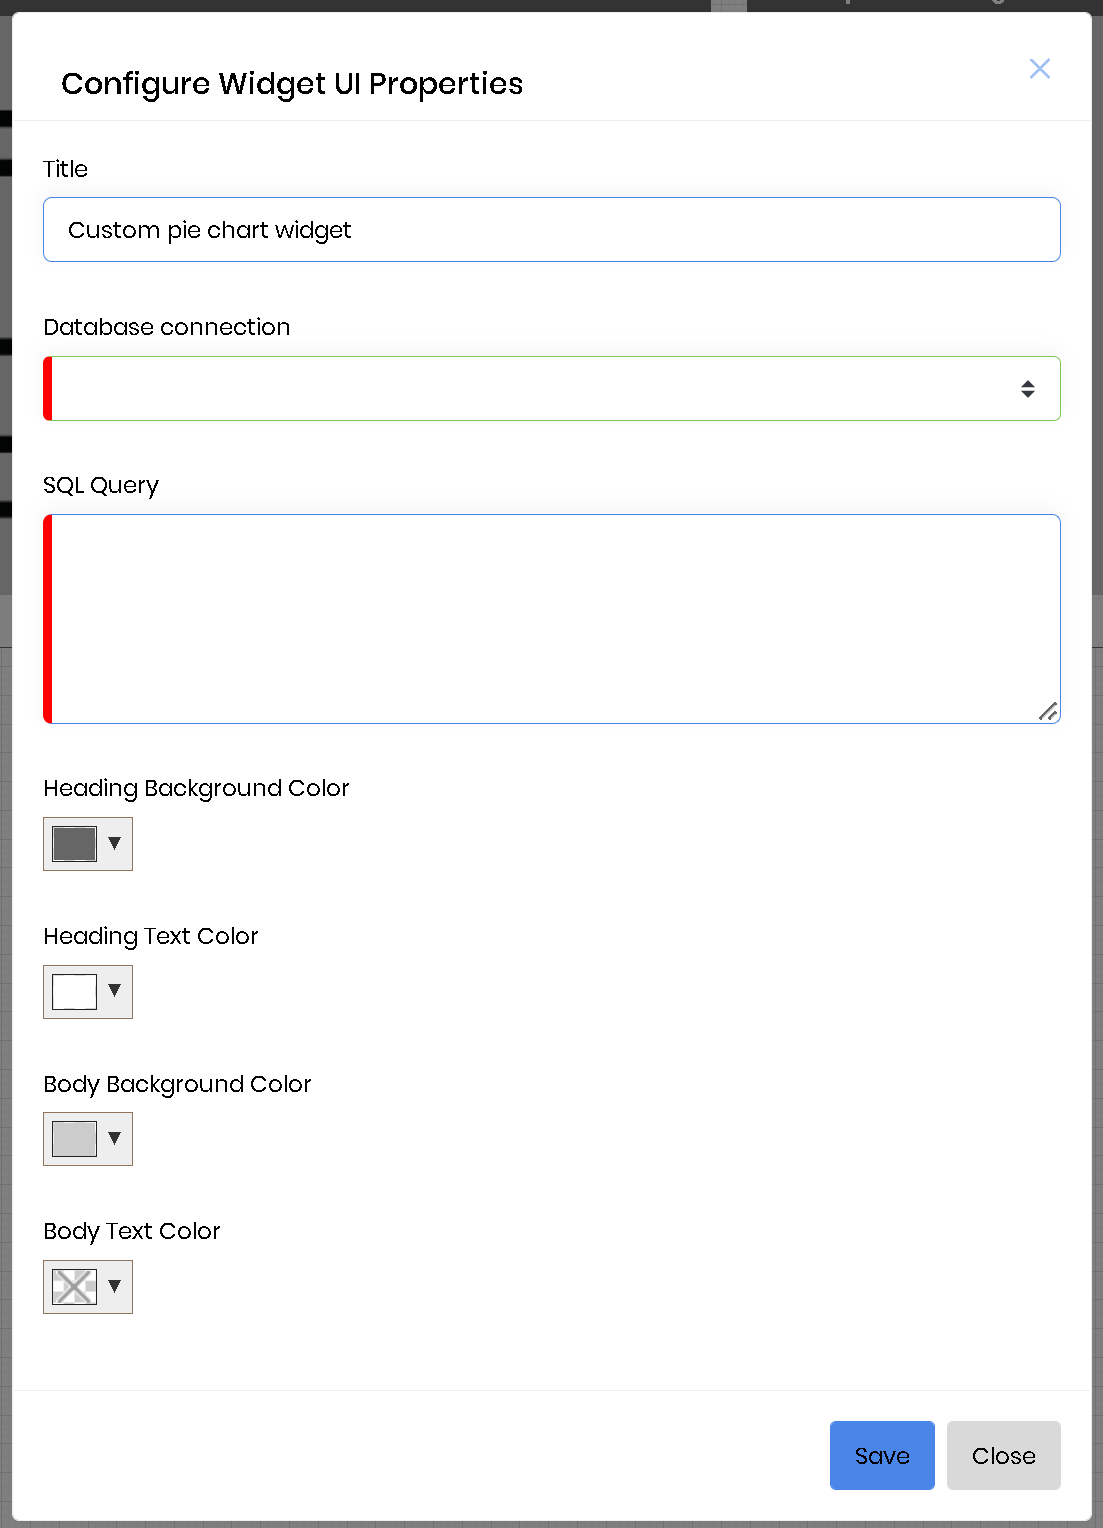
Let's say we want the graph to display the top 10 users with most activity from FlowWright as a pie graph. Then select an existing connection to the FlowWright database, or if a connection doesn't exist, create one and select it.
Enter the following SQL statement for the SQL query input field:
SELECT TOP 10 U.deExternalUserFullName as Name, COUNT(H.entryID) AS numOfHighestActivity
FROM deItemHistory H INNER JOIN deUsers U ON U.deUserID=H.itemID
GROUP BY H.itemID,U.deExternalUserFullName ORDER BY numOfHighestActivity DESC
Click the "Save" button to save the configuration. Click the preview icon on the widget to preview the pie chart. Preview should display the following: