FlowWright dashboard designer provides 2 kinds of dashboard widgets:
- Preconfigured functional widgets - functionality is already built into the widget, only customization is the header text and colors
- Customizable widgets - these widgets can be customized to bring data based on a SQL query or a configuration and render the data within the widget. Also header text and colors can be also changed
Example of an Preconfigured widget
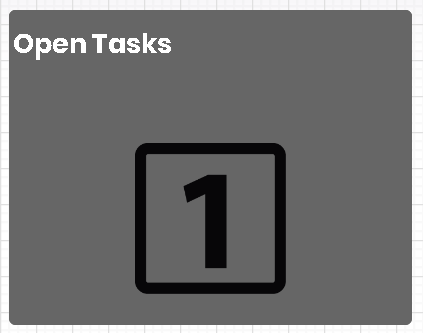
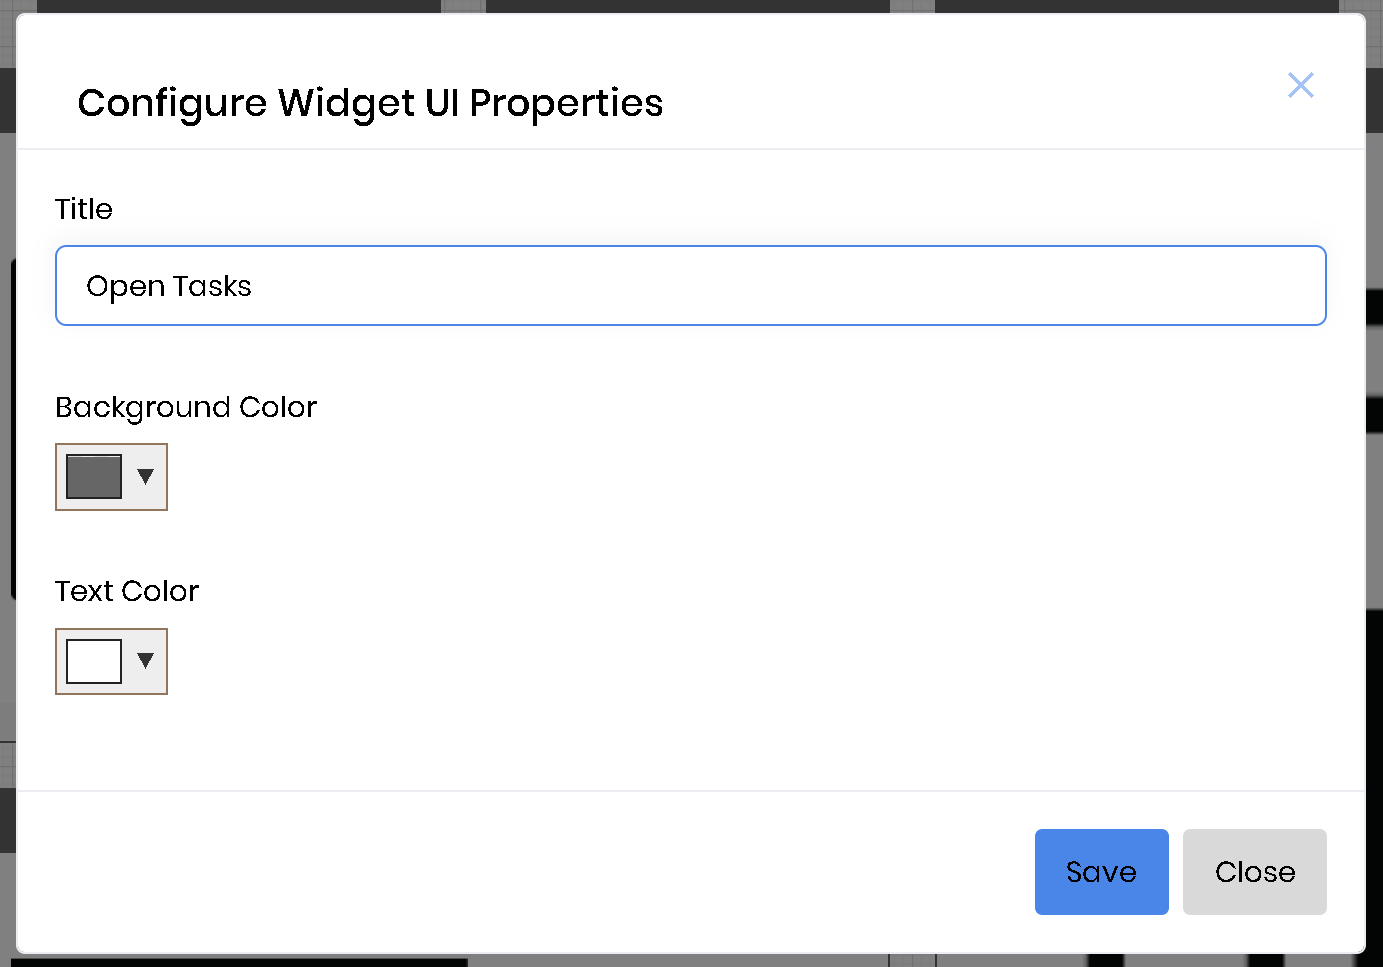
The above widget by default has the functionality to display the # of open tasks for the current user. The above widget only allows the following configuration:
Example of an Configurable widget
Custom bar chart widget allows the user to use a database connection and a SQL query to be configured to display a graph based the query result data. The custom bar chart widget has the following configuration. Select the database connection from the dropdown list. Provide a SELECT SQL Query in the input field. Save the changes and preview the dashboard.
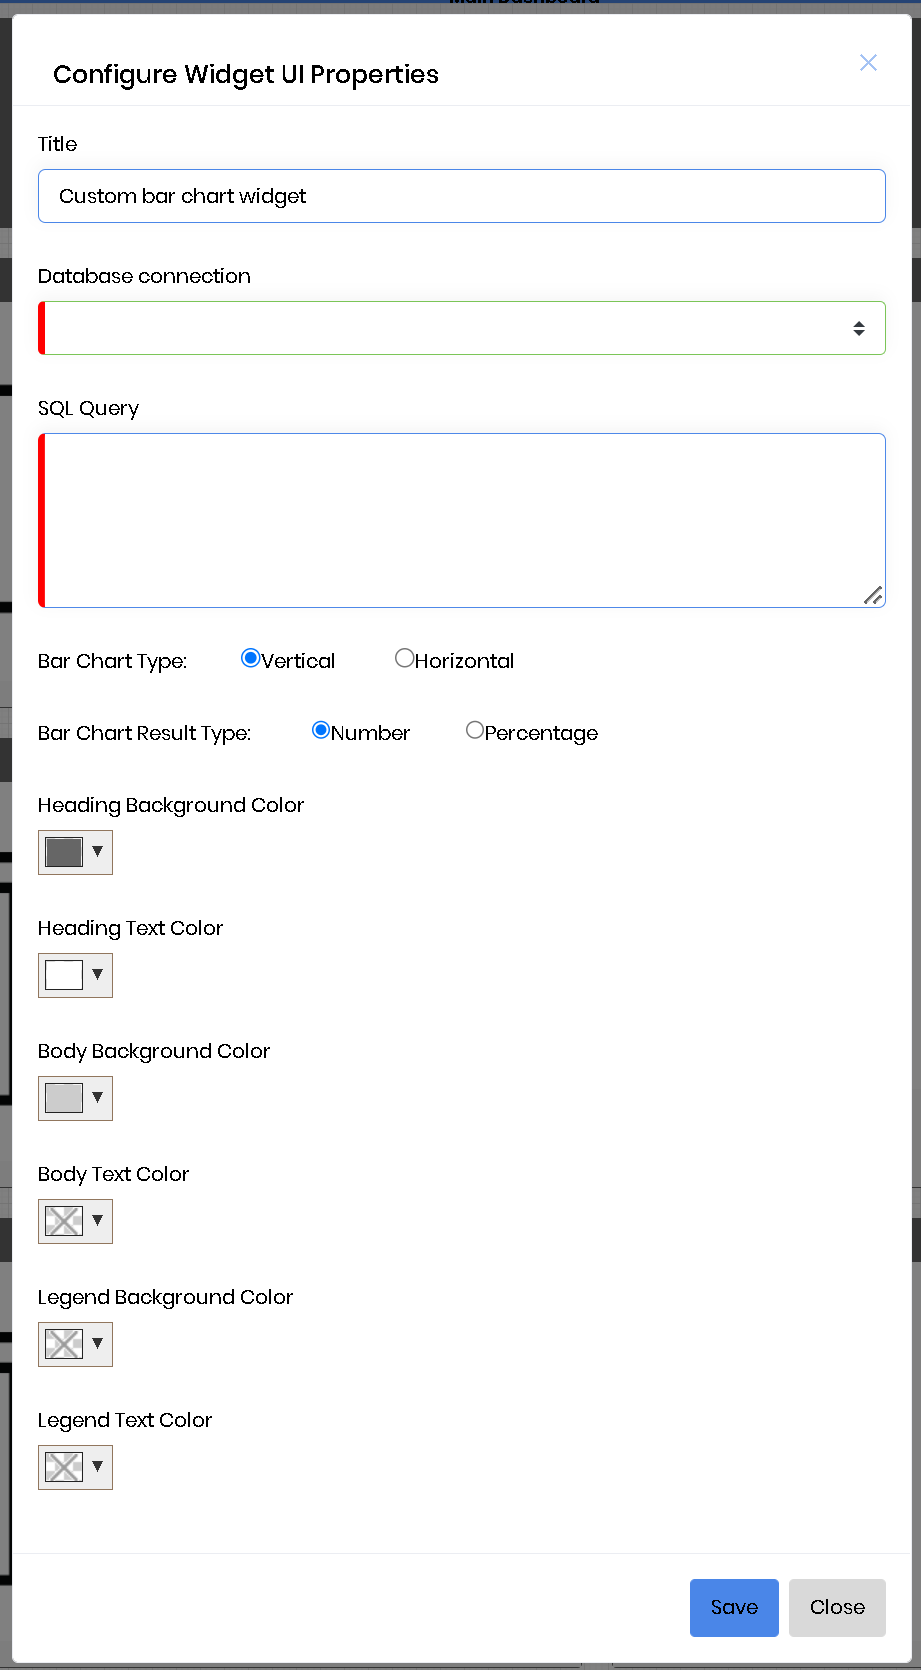
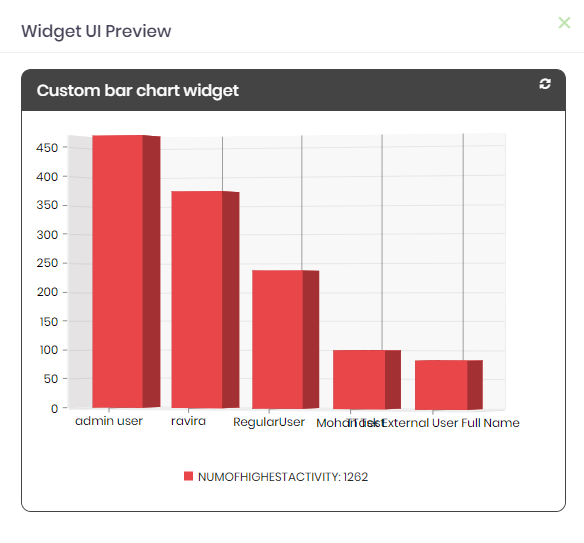
Let's say we want the graph to display the top 5 users with most activity from FlowWright as a bar graph. Then select an existing connection to the FlowWright database, or if a connection doesn't exist, create one and select it.
Enter the following SQL statement for the SQL query input field:
SELECT TOP 5 U.deExternalUserFullName as Name, COUNT(H.entryID) AS numOfHighestActivity
FROM deItemHistory H INNER JOIN deUsers U ON U.deUserID=H.itemID
GROUP BY H.itemID,U.deExternalUserFullName ORDER BY numOfHighestActivity DESC
Click the "Save" button to save the configuration. Click the preview icon on the widget to preview the pie chart. Preview should display the following: