All workflow performance data is exportable to the reporting software of your choice. Business intelligence reporting is a built-in feature of FlowWright. The Business Intelligence Reporting tab enables users to view both runtime and historical workflow performance data.
You'll need to navigate to the Analytics - Business Intelligence menu option.

The BI UI is rendered as below.

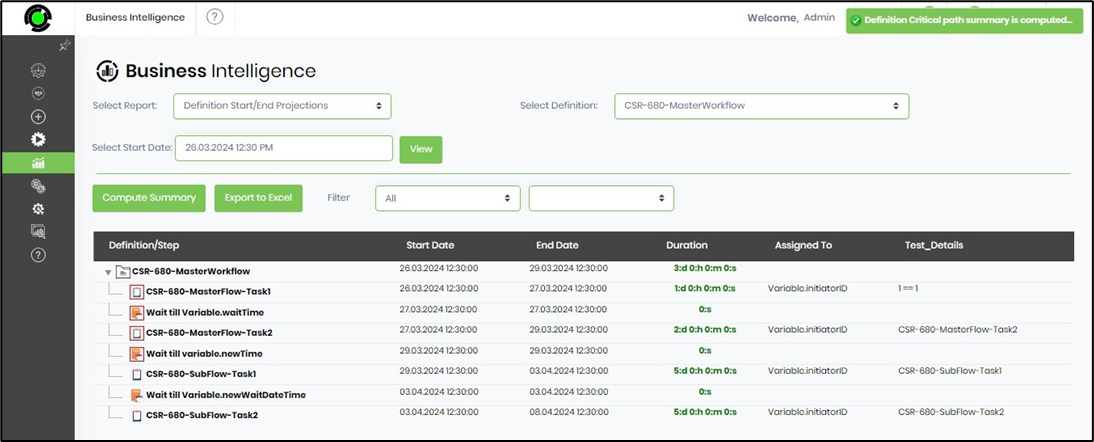
Select report type “Definition Start/End Projections”. Select the process definition from the dropdown list. Select the start date from the date picker. Click on the View button. The previous report, if existing, is rendered on the same page. Click the “Compute Summary” button. The report is projected from the start date and rendered as shown below.
Select report type “Instance Plan, Actual & Projected.” Select the process definition and its process instance from the dropdown list. Click the “Compute Summary” button. The instance report is rendered as shown below.

Select report type “Definition Projections with Configurations.” Select the process definition. Select the start date from the calendar. Click the “Compute Summary” button. The instance report is rendered using the projection start date as below.

Select report type “Instance Plan, Actual, and Projected with Configurations.” Select the process definition and its process instance. Select the start date from the calendar. Click the “Compute Summary” button. The instance report is rendered using the projection start date as below.

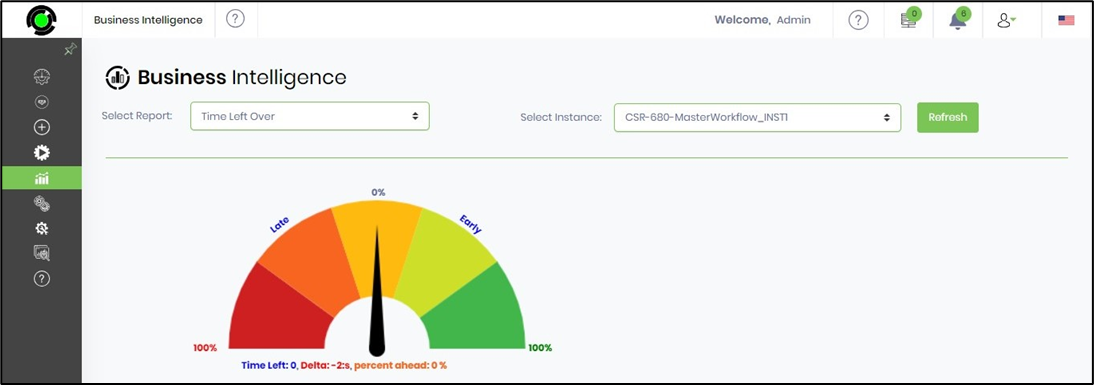
Select the report type “Time Left Over.” Select the process instance from the dropdown list. Click the “Refresh” button. The previous instance report is used to calculate the remaining time, and the report is displayed below.
Select report type “Step Execution by Instance.” Select the process instance from the drop-down list. Select the kind of report to view: a Chart or a Table. The execution instance table is displayed below.

Select the report type “Step Execution by Definition.” Choose the process definition from the drop-down list. Select the type of report you want to view: a Chart or a Table. The execution definition table is displayed below.

Select the report type “Least/Most Common Executions.” Choose the process definition from the drop-down list. The execution report is displayed below.

Select the “Variable States.” Select the instance from the drop-down list. The report is displayed below.

Select the report type “Definition-Instance Summary.” Select the definition from the drop-down list. The status report is rendered below.

Select the report type “Instance-Audit Report.” Select the Instance from the drop-down list. The audit report is rendered below.

Select the report type “Instances by Status.” Select the date duration from the drop-down list. Provide the start and end dates for the custom date type. The status report is rendered below.

Select the report type “Instances by Date.” Select the date duration from the drop-down list. Provide the start and end dates for the custom date type. The status report is rendered below.

Select the report type “Engine Alerts by Status.” Select the date duration from the drop-down list. Provide the start and end dates for the custom date type. The status report is rendered below.

Select the report type “Engine Alerts by Date.” Select the date duration from the drop-down list. Provide the start and end dates for the custom date type. The status report is rendered below.

Select the report type “Engine Alerts by Server.” Select the date duration from the drop-down list. Provide the start and end dates for the custom date type. The status report is rendered below.

Select the report type “Events by Status.” Select the date duration from the drop-down list. Provide the start and end dates for the custom date type. The status report is rendered below.

Select the report type “Events by Date.” Select the date duration from the drop-down list. Provide the start and end dates for the custom date type. The events report is rendered below.

Select the report type “Form Instances by Status.” Select the date duration from the drop-down list. Provide the start and end dates for the custom date type. The events report is rendered below.

Select the report type “Form Instances by Date.” Select the date duration from the drop-down list. Provide the start and end dates for the custom date type. The instance report is rendered below.

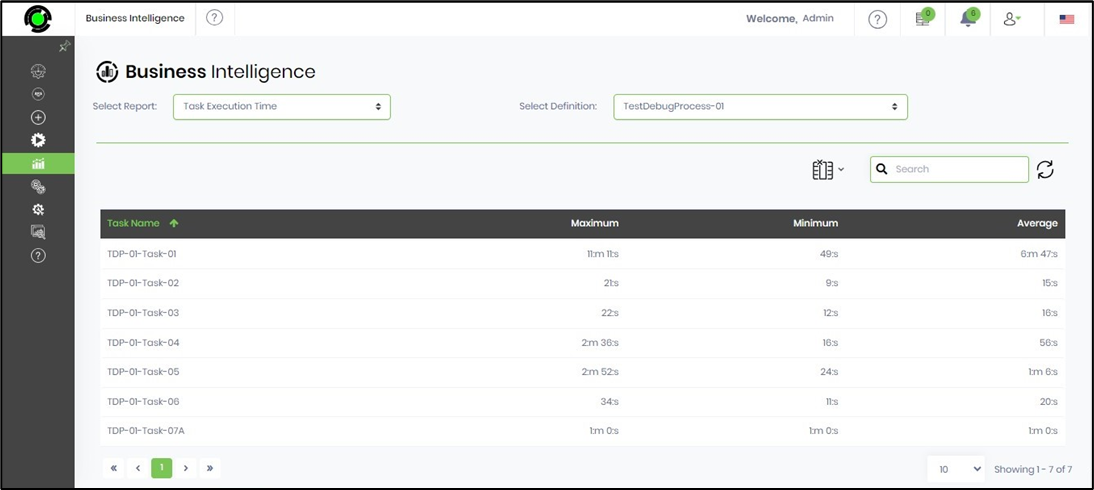
Select the report type “Task Execution Time.” Select the process definition from the dropdown list. The previous process instance is used to compute the task execution time, and the report is rendered on the same page, as below. Use the Search box to narrow down the result table.
These business intelligence reports can be configured to report data within a specified date range. The pull-down menu enables users to select from options such as today, this week, last week, this month, and last month, as well as custom date ranges. All dates and times are stored in the database as UTC and displayed based on the user's local time zone.
Note: Engine runtime data is in ISO + UTC format.
Select the report type “User Involvement Report.” Choose the process definition from the drop-down list. Select the type of report you want to view: a Chart or a Table. The user involvement table is displayed below.

Select the report type “Time Between Steps.” Choose the process definition from the drop-down list. Select the duration type (all, today, this week, last week, this month, last month, and custom dates) from the drop-down list. Select the start and the end step from the drop-down list. Click the View button. The time spent between the two steps is displayed as a table below.
