Most dashboard widgets are designed for non-technical users and share a similar UI configuration. You typically drag a widget onto the designer canvas and edit it to set the title, text colors, foreground and background colors, database connection, SQL query, date filter column, and more. Rendering data through a custom DLL is now possible with FlowWright's Dashboard Custom Function Widgets.
Here's a list of dashboard custom function widgets: bar chart, data table, HTML, number, and pie charts.
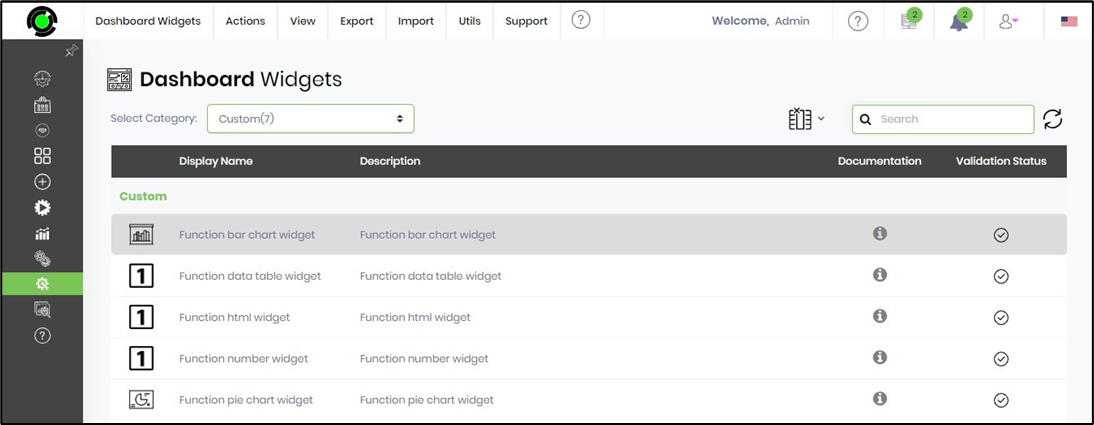
The custom function widgets share similar configurable UI features. After dragging a function widget onto the dashboard designer canvas, click the Edit icon to configure its properties.

Our UI allows you to fully customise your dashboard's appearance. Enter the best title text in the Configure Widget U properties window. Choose one of your custom function DLLs from the drop-down list. Select the appropriate function from the same list. Provide the reference to the SQL table's date column to sort the results by date.

Note: Suppose you've created the following SQL query to return the result set using the getData function. You should include the $dateFilter wildcard condition in the Select query, as shown below.
select status, count(*)
from deInstances where createdBy = '35635c17-06b5-455b-a1e6-51507c1e971f'
and $dateFilter
group by status
Then, you need to specify the date column of the SQL table for the date filter to function as shown below.

Use the option to select the bar chart type as either vertical or horizontal. Use the option to choose the result type as either number or percentage. Select the colors from the drop-down list for the heading, body, and legend text. Click the Save button to confirm the configuration.
Note: The Admin places the custom function DLL in the root folder of the FlowWright application server.
On the dashboard designer canvas, choose the UI > Preview menu option to view the dashboard.
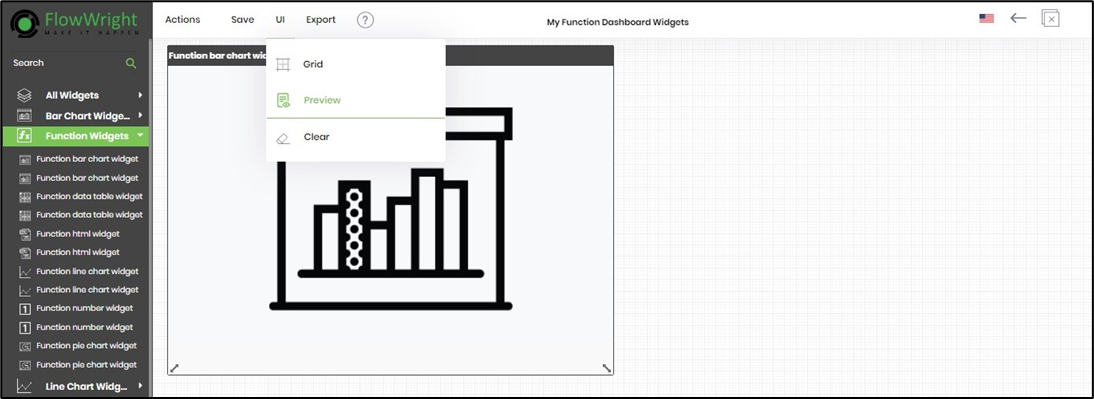
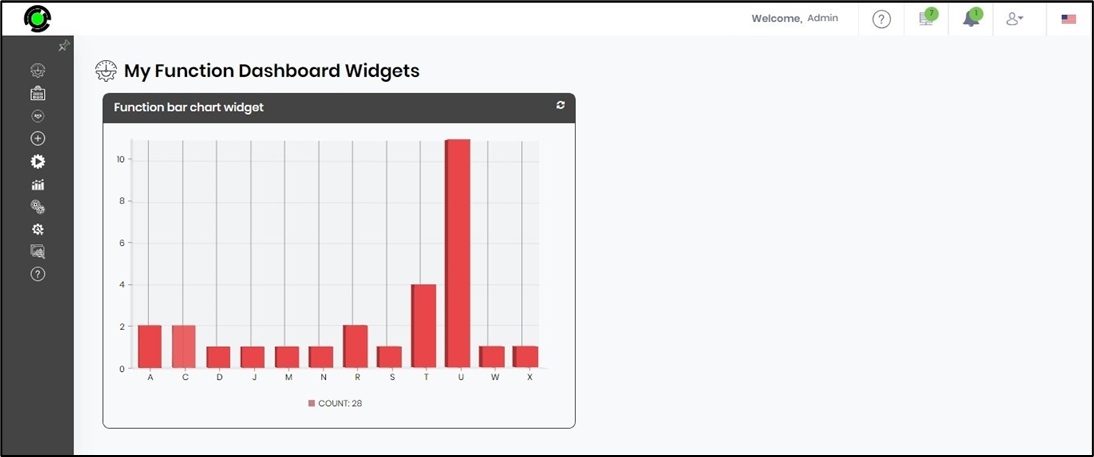
The widget dashboard function appears on the new page.
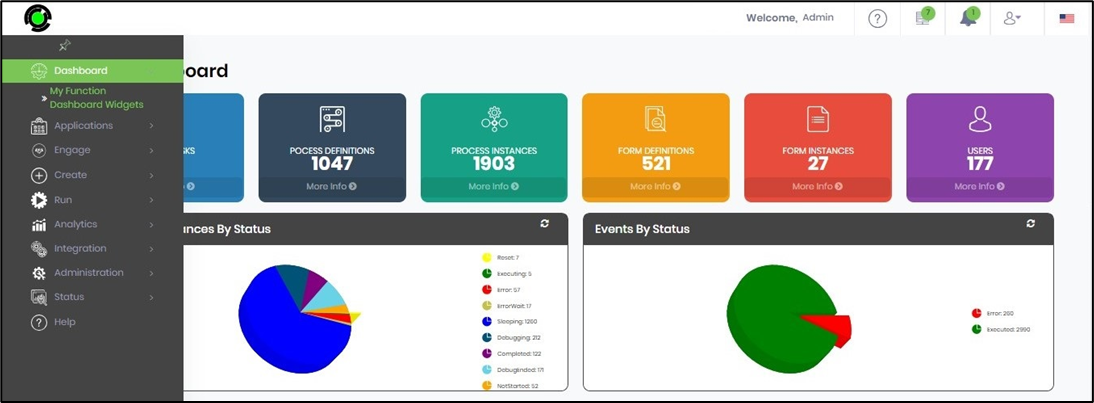
To view the dashboard in the menu pane, select the Utils > Show/Hide option on the dashboard designer canvas.

Refresh the FlowWright Dashboard page to see the new dashboard in the left pane, as shown below.
You can view this video to learn more.