This function generates BI reports on tenants' usage based on history, top 10 users by activity, errors, logins, etc.
On the Tenant Manager page, navigate to the Analytics - Business Intelligence menu option to view the UI.
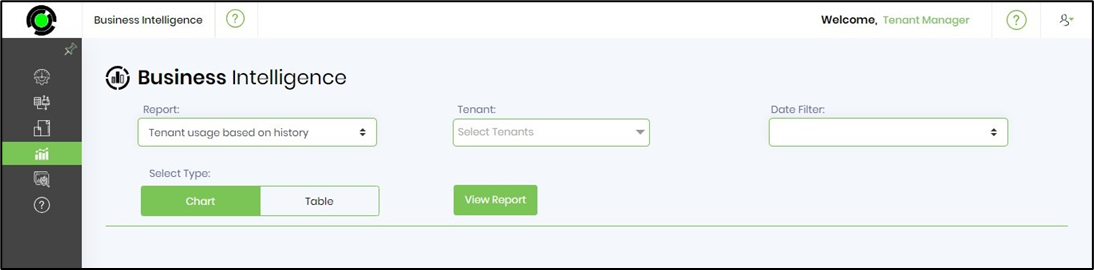
Select the Report Type from the drop-down list.

Choose the tenant from the mult-choice list. Select the date filter from the drop-down list. Select the report type between Chart or Table. Click the View Report button to generate.

The Tenant Usage report is included below for you to look over. You may use the Search textbox to filter the results further.

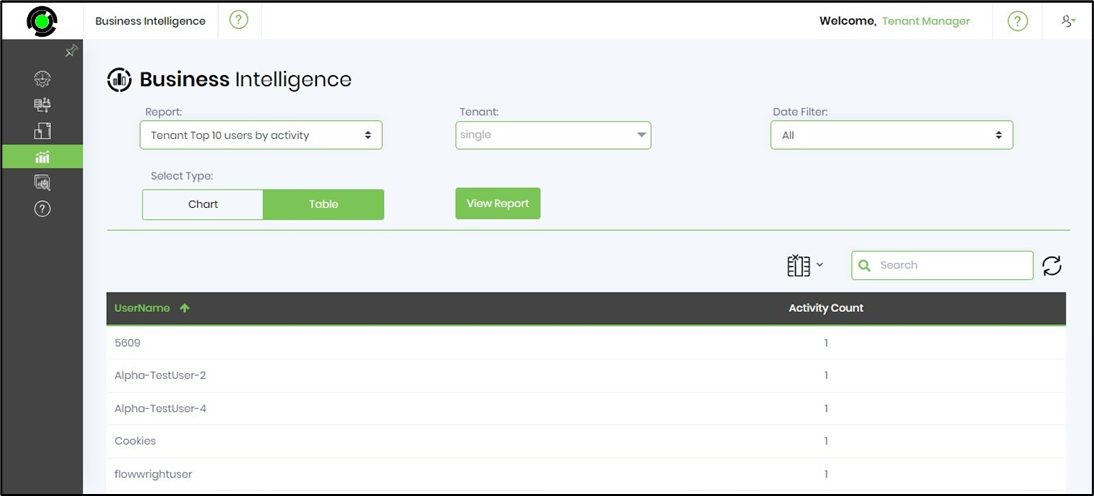
The Tenant Top 10 Users by Activity report is included below for review.
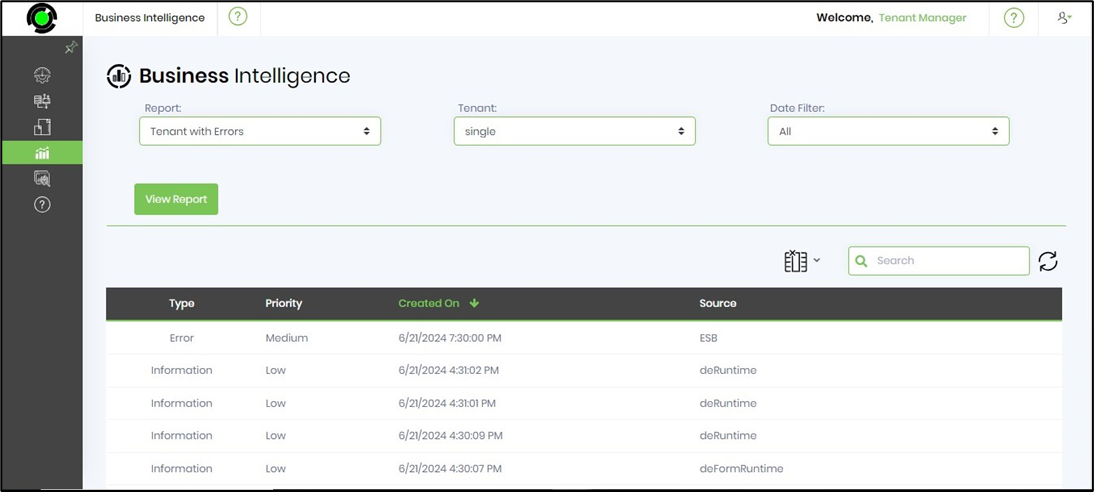
The Tenant with Errors report is included below for you to look over.
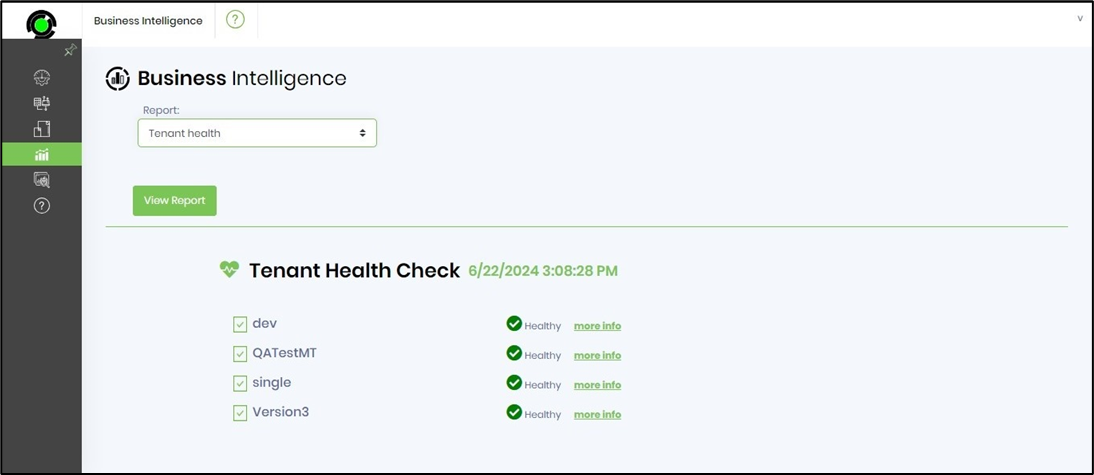
The Tenant Health report is included below for you to look over. Click on the “more info” link against the Tenant row item.
The complete health check for the Tenant is displayed below (for reference).

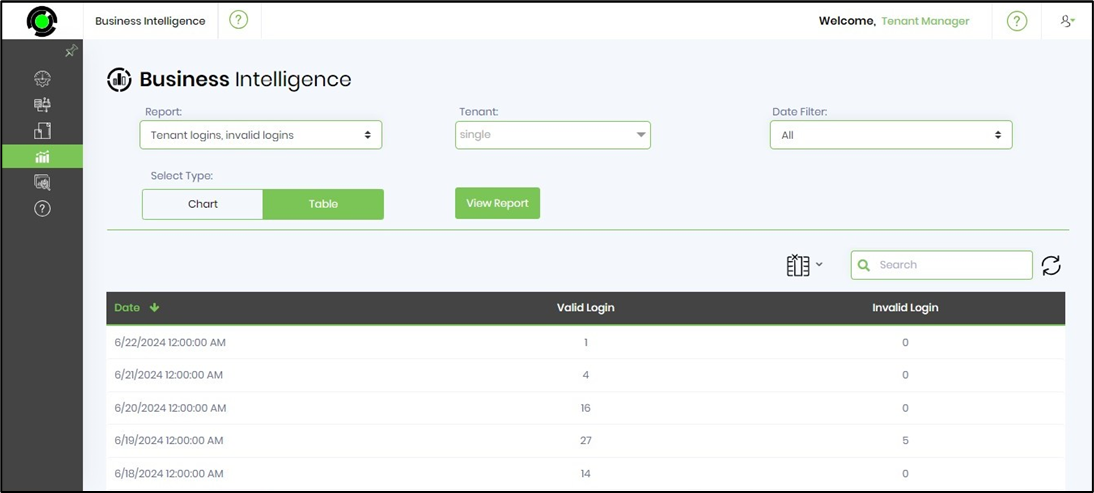
The Tenant Logins and Invalid Logins report is included below for review.