This function lets you configure dashboards for more effectiveness.
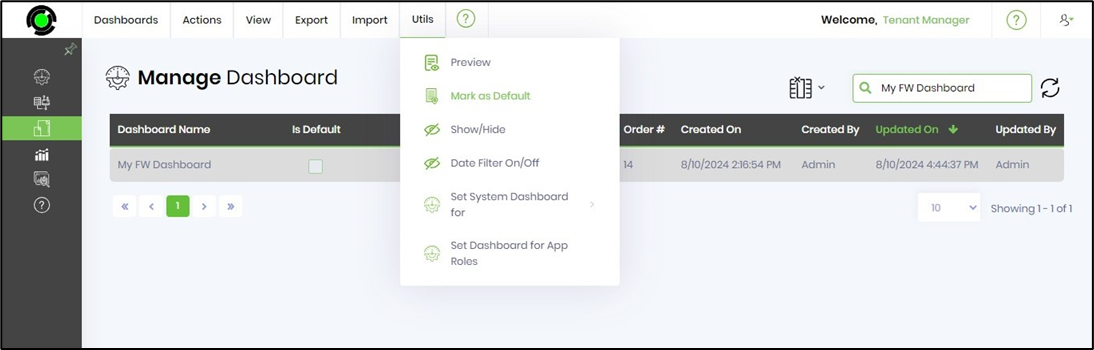
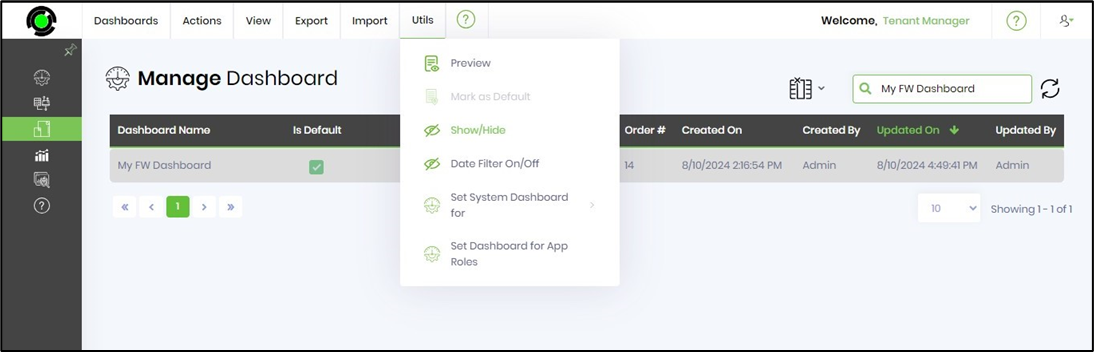
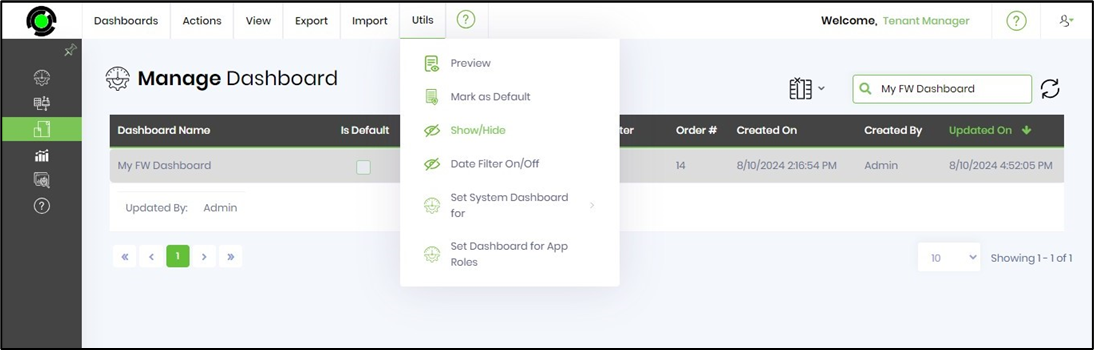
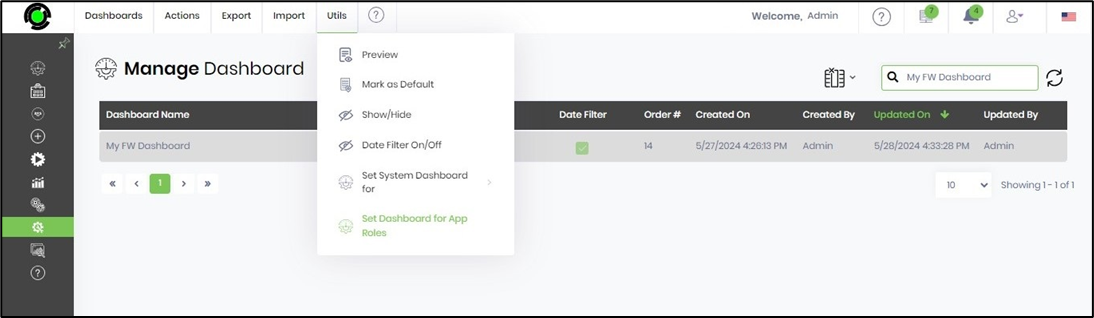
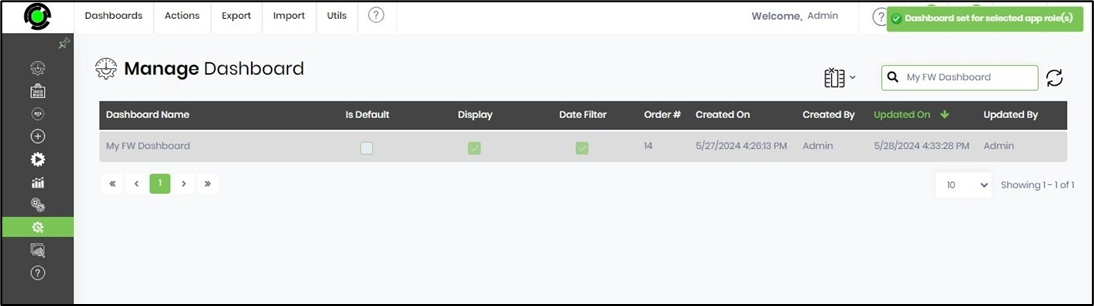
You must navigate to the Administration > Dashboard page. Select a dashboard from the list and click the Utils menu option.
Mark the dashboard as the user's default dashboard.
Select the Mark as Default menu option. This option lets you set the selected dashboard as the default for the current user and all FlowWright users. When a user logs in, the default dashboard is visible.
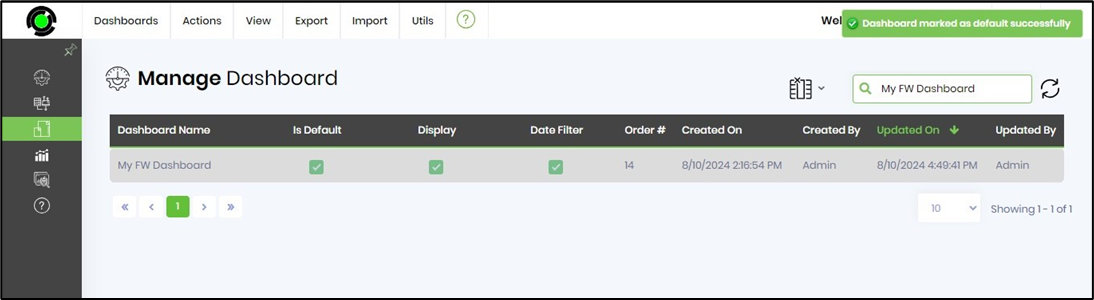
A confirmation message appears in the top-right corner.
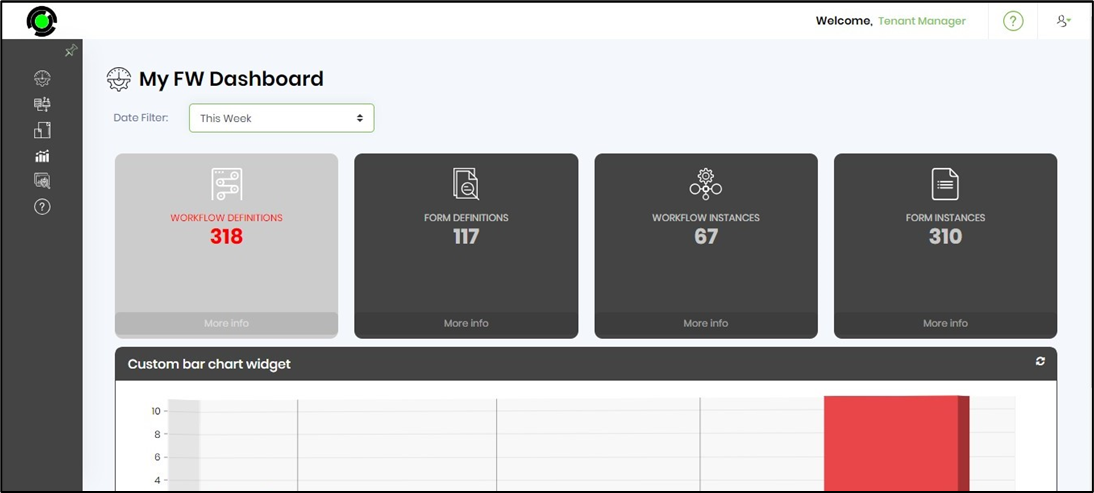
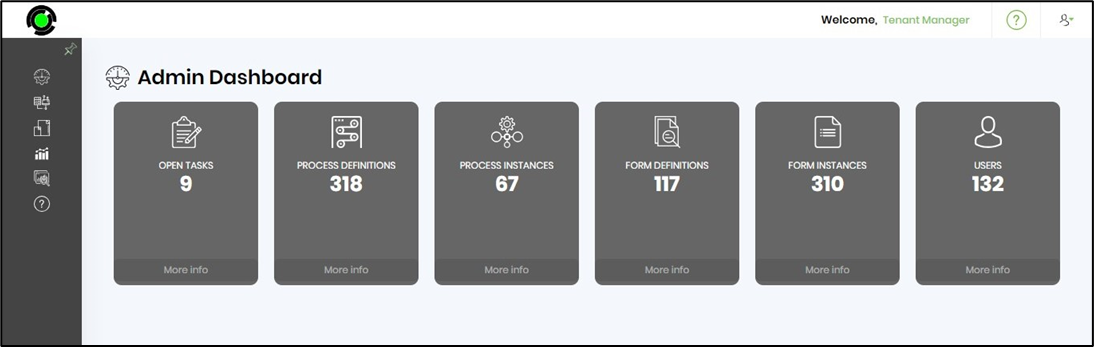
When the user logs in, the default dashboard is displayed.
To undo the default dashboard configuration, select the dashboard, then click the Utils > Show/Hide menu option.
The default dashboard configuration is reset, and a confirmation message is shown in the top-right corner.
Selecting the Dashboard menu option in the left pane now displays this message. The default dashboard needs to be configured again.

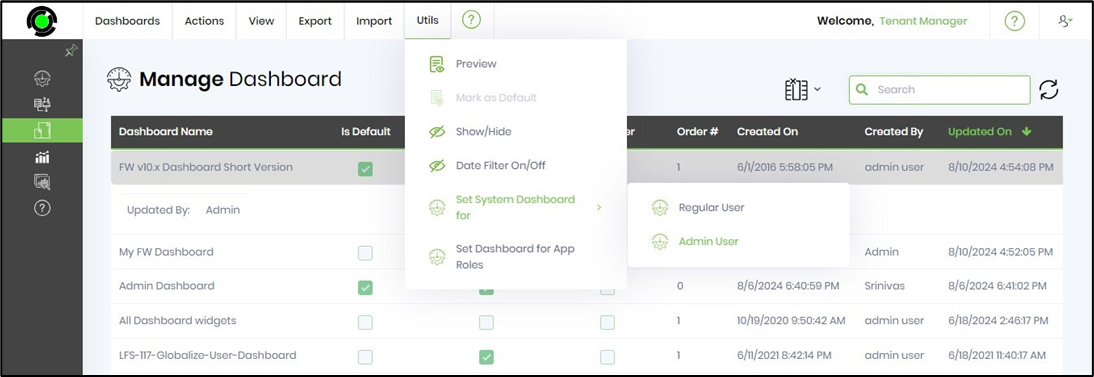
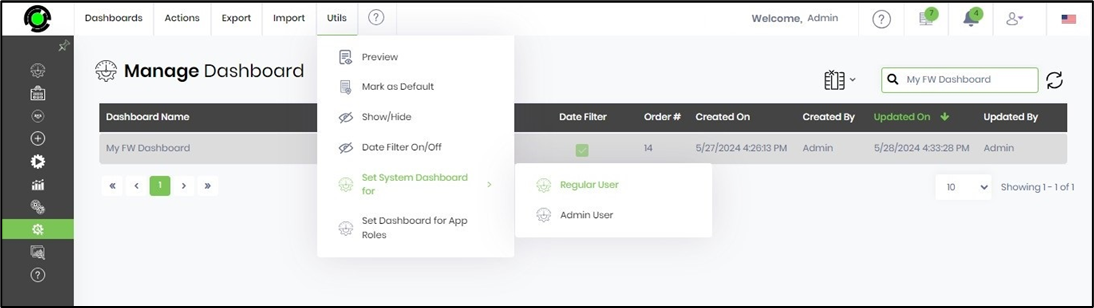
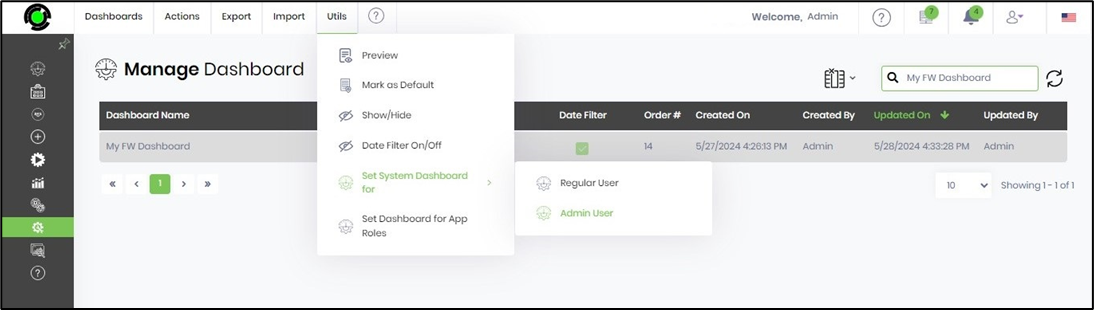
To reconfigure the default dashboard, select the dashboard from the table, then click the Utils > Set System Dashboard For > Admin User menu option.
The selected dashboard is now the default, and a confirmation message is shown in the top-right corner.

Selecting the Dashboard menu option in the left pane now displays the new default dashboard.
Show/Hide the dashboard.
This toggle lets you configure or remove the selected dashboard as a menu item in the left pane for quick access.
Click the Utils > Show/Hide menu option to configure the dashboard as a menu item.
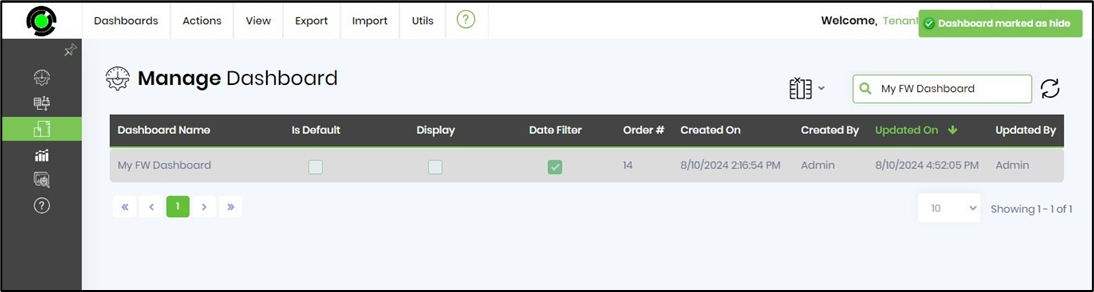
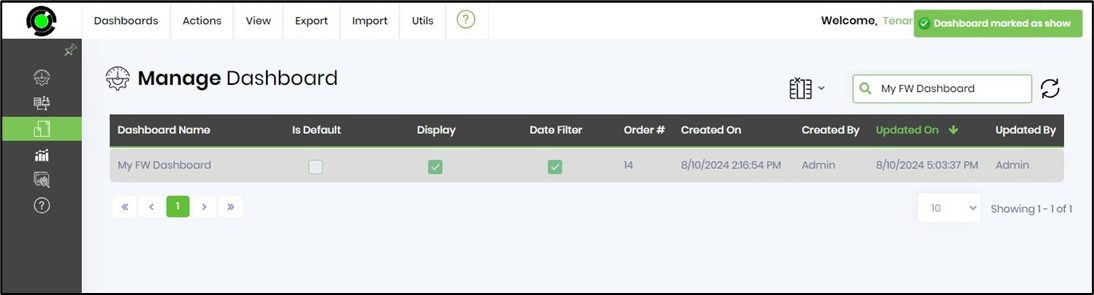
A status confirmation message appears in the top-right corner.
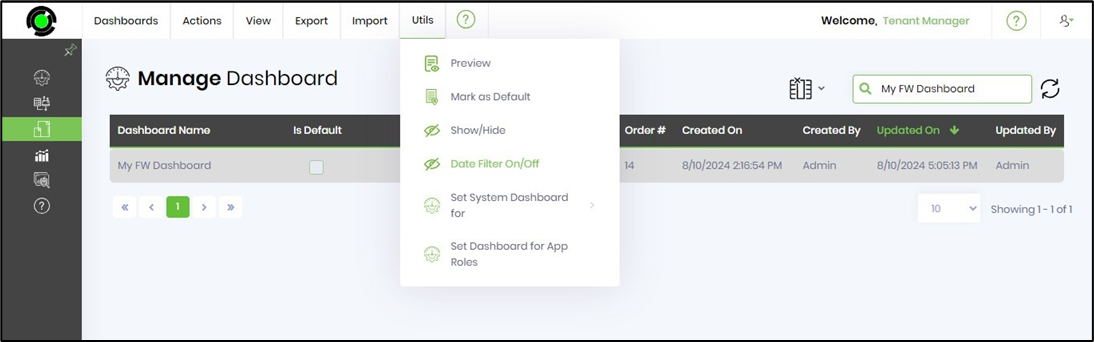
Date Filter On/Off.
This toggle lets you configure (or undo) the dashboard's sorting using the date filter.
Click the Utils > Date Filter On/Off option to configure the dashboard to use the date filter.
The date filter is enabled on the dashboard, and a confirmation message is shown in the top-right corner.

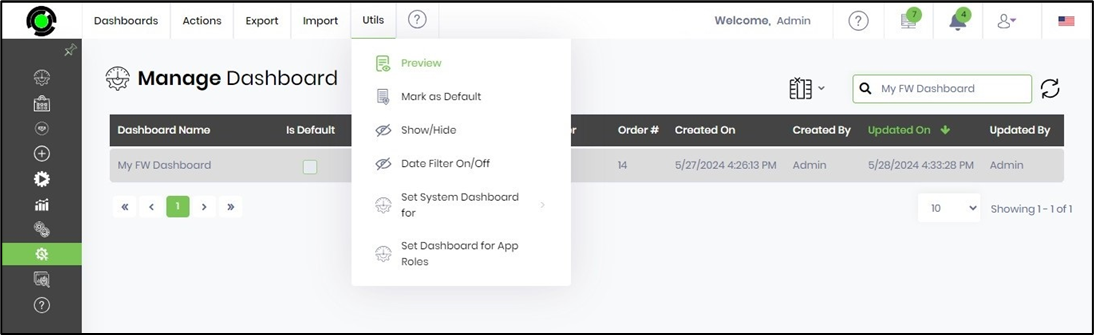
To view the dashboard with a date filter, select the dashboard, then click the Utils > Preview menu option.
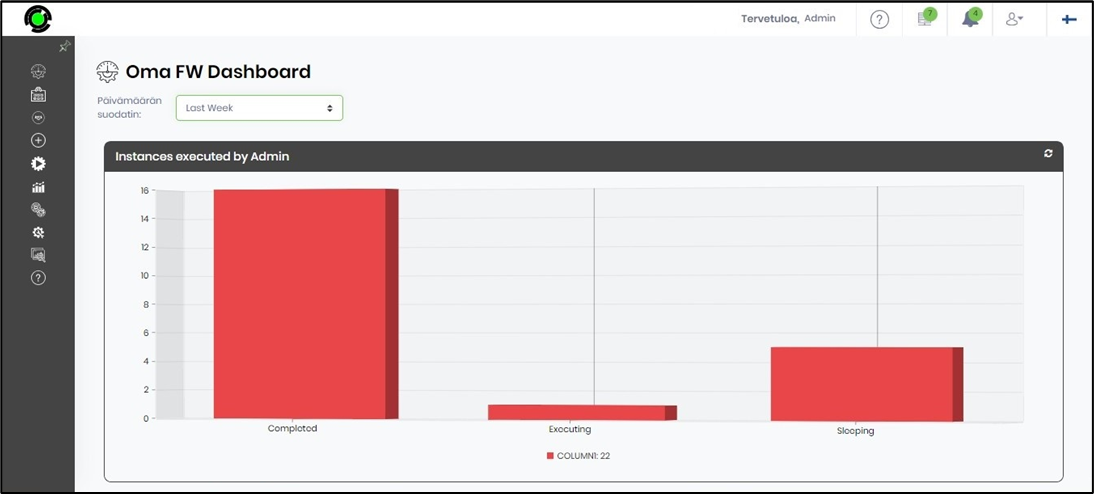
The dashboard is rendered on a new page with a date filter, as shown below. Note: The date filter does not affect the number of widgets. The custom widgets' functions are enhanced using the date filter.
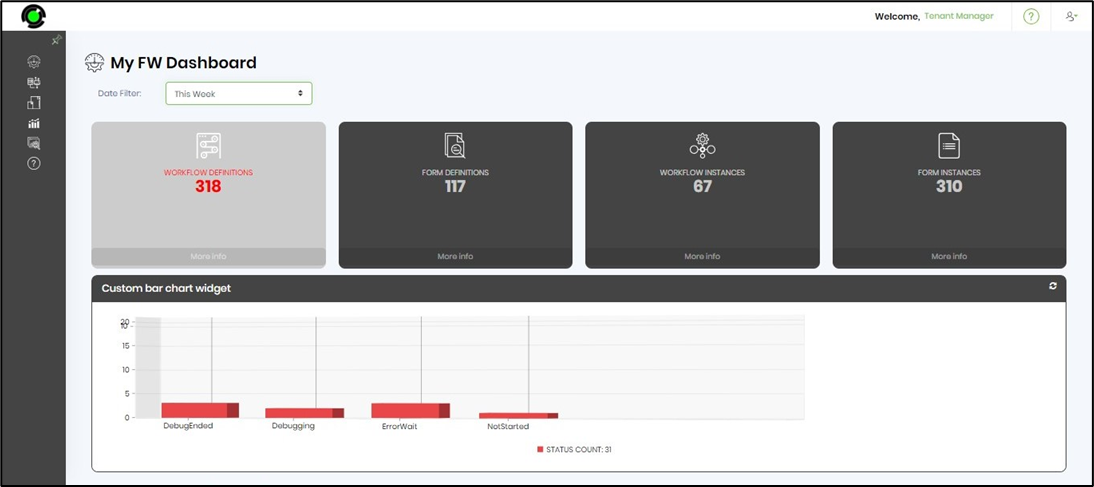
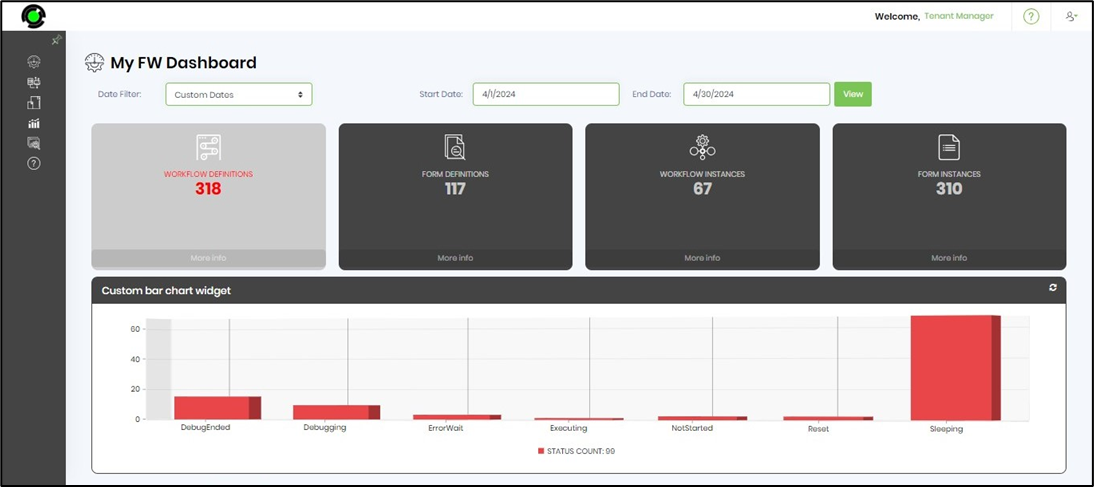
Click the date filter drop-down list to select another timeline.

The dashboard is refreshed with the selected timeline, as shown below. You will observe that the bar chart widget displays different data points based on the selected timeline.
Set Dashboard for App Role.
This function lets you grant or revoke permissions for the application role on a specific dashboard. Application roles control how dashboards are displayed to a user. When a user logs in to the FlowWright UI, based on their roles, a list of accessible dashboards will be available in the menu.
You must select the dashboard from the list, then click the Utils > Set Dashboard for App Role menu option.
A pop-up with application roles appears, allowing you to select from a drop-down list. You may choose one or more app roles from the list below. Click the Set button to confirm.
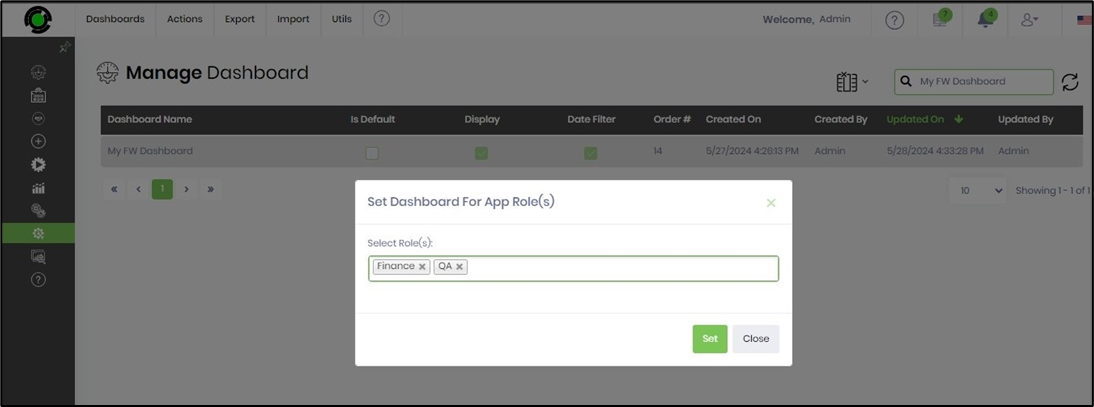
Users associated with the app roles listed above have privileges to access the dashboard. A confirmation message is displayed in the top-right corner.
Set System Dashboard for Regular User.
This function lets you set a dashboard as the “default” for all users.
Select the dashboard from the list, then click the Utils - Set System Dashboard for - Regular User menu option. The selected dashboard will be displayed when the standard user logs in.
Set System Dashboard for Admin User.
This function lets you set a dashboard as the “default” for ADMIN users.
Select the dashboard from the list, then click the Utils > Set System Dashboard for > Admin User menu option. The selected dashboard will be displayed when the ADMIN user logs in.
Globalize the User Dashboard.
This function lets you globalize a User Dashboard.
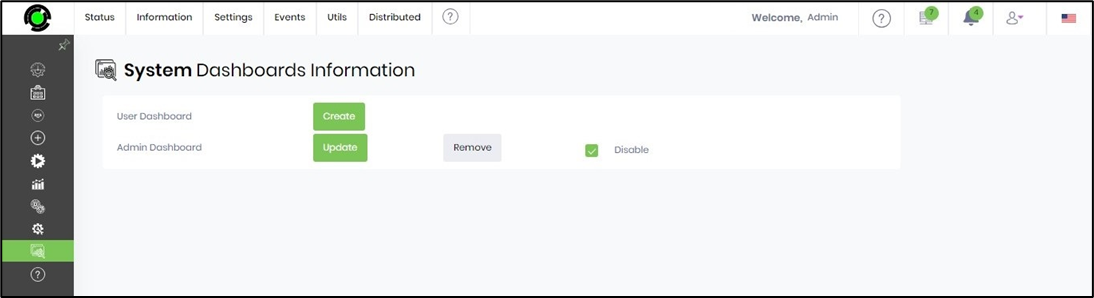
You must navigate to the Status > Status > Utils > System Dashboard page to grant or revoke privileges for creating and updating user and admin dashboards.
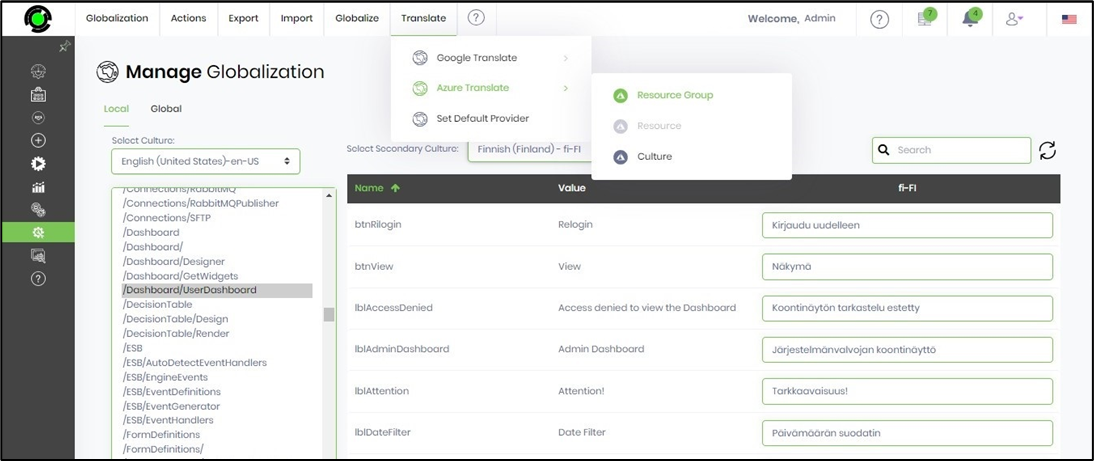
You must navigate to the Administration > Globalization > Manage Globalization page to globalize resources for user dashboards in the “\Dashboard\UserDashboard” system artifact. Select the secondary culture from the drop-down list. Click Azure Translate - Resource Group to globalize all items to the FINNISH culture. You may choose Google Translate as an alternative. Click Save Changes to confirm.
The dashboard can now be previewed in FINNISH by changing the culture flag in the top-right corner.