Building, Configuring and Displaying a Dashboard Pie Chart Widget
This sample will illustrate how to write a new dashboard pie chart widget, how to configure it using the Configuration Manager, add the widget in a dashboard designer and then have the widget displaying in the dashboard.

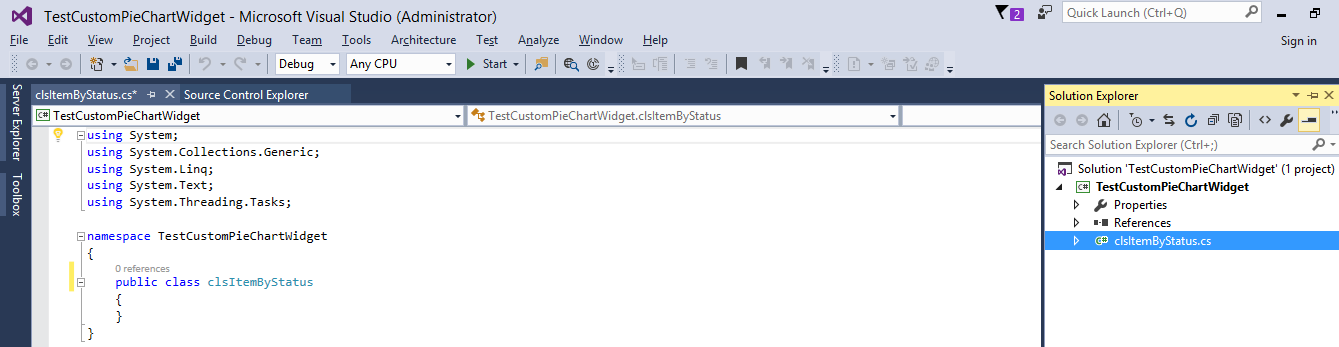
Start Microsoft Visual Studio 2015 and select “New Project”. Select “C#” as the language and select “Class Library” as the project type. This example is going to use C# as the development language. This same example can be also written using Visual Basic .Net.
For the name of the project, provide “TestCustomPieChartWidget”.

Once the project is created, select “Class1.cs” and rename the class to “clsItemByStatus.cs”

Right click References under TestCustomPieChartWidget Project. Click Add Reference…

Reference manager window will open. Click browse button.

Add a reference to FlowWright, navigate to the following directory “C:\inetpub\wwwroot\cDevWorkflow\bin”. Select the file “cDevDecisionEngine.dll”.

Add a using statement : cDevWorkflow.cDevDecisoinEngine

Let’s start building the class, first implement the interface called: “dePieChartWidget“. The getData method is going to return clsPieChartWidgetReturn object. clsPieChartWidgetReturn has chartData property. The chartData property returns List<dePieChartSeries>.Each dePieChartSeries object in the list indicates series in the pie chart. dePieChartSeries has three properties such as label which is used as the series name, color which applies color to the corresponding series related to the series and data which contains actual data for the corresponding series.

Add the widgetData attribute above the “clsItemByStatus” class. The attribute accepts four parameters. The first parameter will be the widget name. Second parameter accepts the widget description. Third parameter will be the widget category. Fourth parameter is the widget display name.
Using widgetData attribute, we could automatically configure the widget in the configuration manager.

Navigate to the directory where the DLL was compiled to and select the DLL: “TestCustomPieChartWidget.dll”. Right click on the file and select “Copy” from the context menu.

Copy the widget dll to the following directory: “C:\inetpub\wwwroot\cDevWorkflow\bin”.

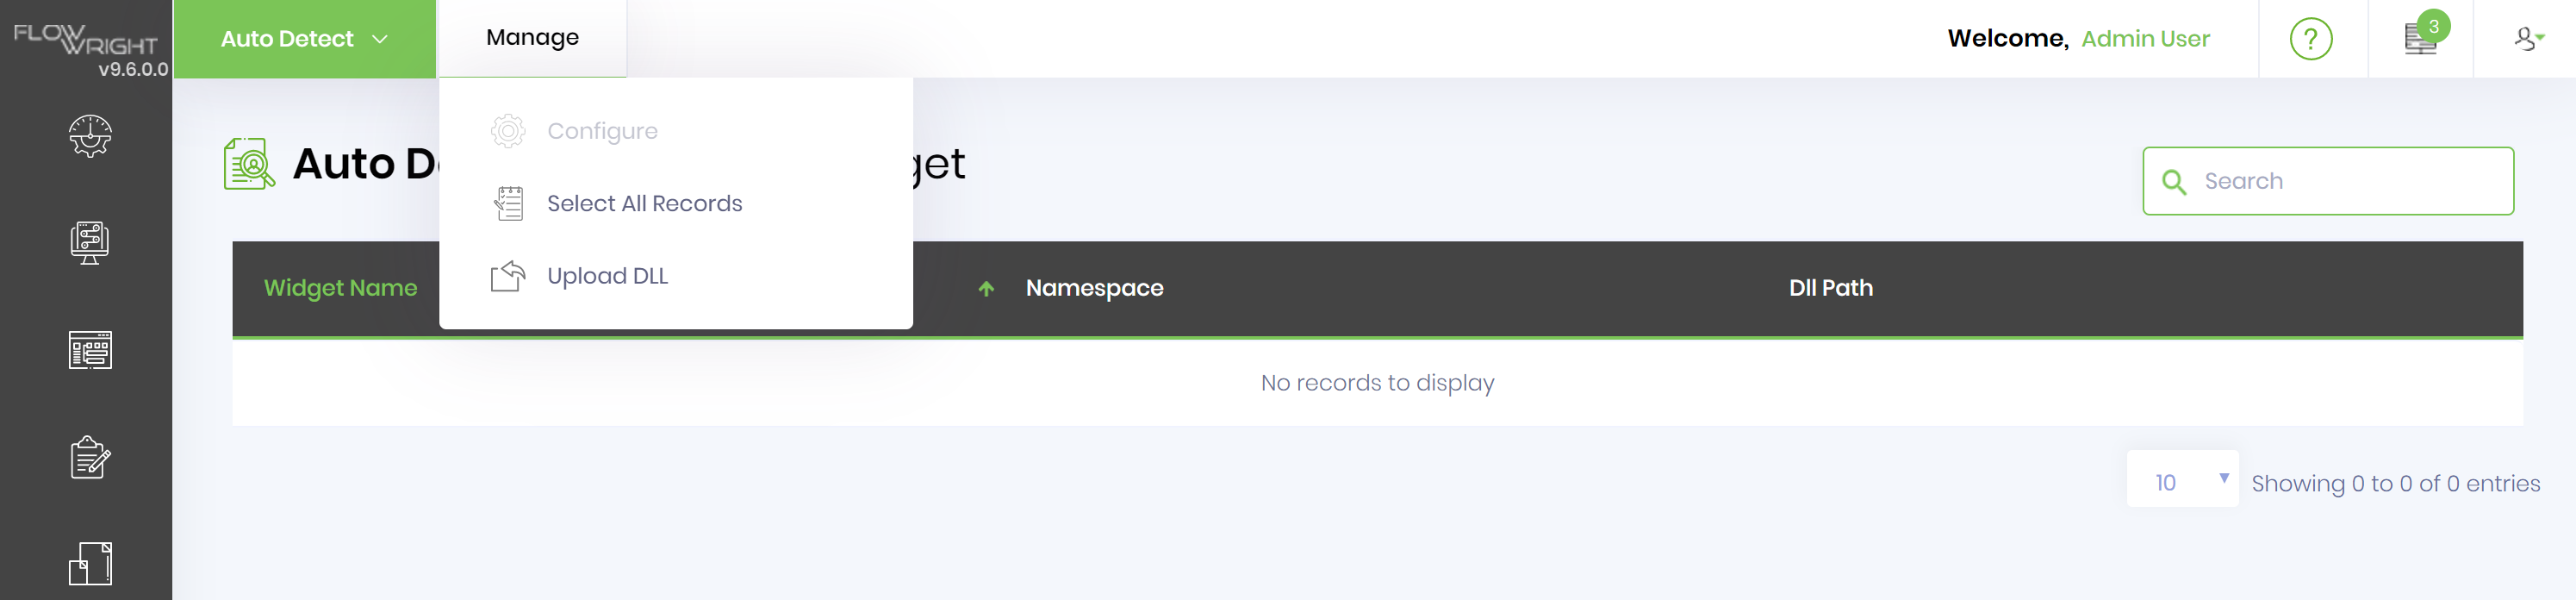
Start the FlowWright Configuration Manager > Manage Dashboards and select the “widgets” menu.

Select “UtilsAuto Detect” menu item. A new tab will open, which displays the list of widgets to configure.

Select the widget, and select “ManageConfigure” menu item.
Let’s create a new dashboard and place the configured pie chart widget, goto the dashboard management on the menu:


Now that the widget is fully configured, let us add the new widget in a dashboard. Go to Manage Dashboards. Create a new dashboard called “TestCustomWidgetDashboard”. Enter the new dashboard name, select the layout and click the “Create” button to create the dashboard.


Drag the “Item by Status” widget from the side toolbar and drop it to the placeholder in the right pane. Click save and preview on the dashboard menu.


In order to change the widget properties, use the context menu on the widget.

Change the heading and body background and text color for the selected widget. Click save.

Click save and preview the dashboard.
