The following options are available for the report:
- Recompute report data
- Export to Microsoft Excel
- Export to Microsoft Project
- View Gantt Chart
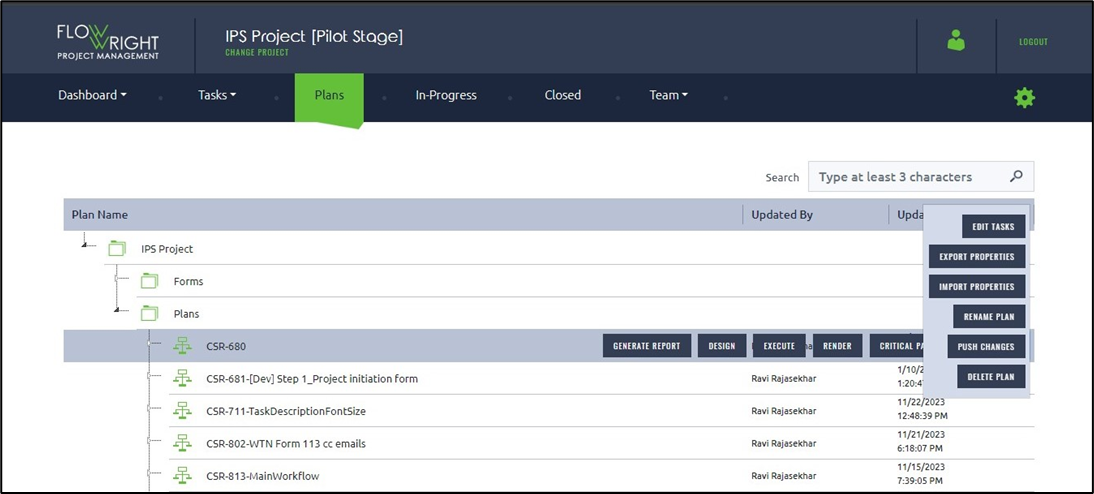
Select a plan and click the Generate menu option.
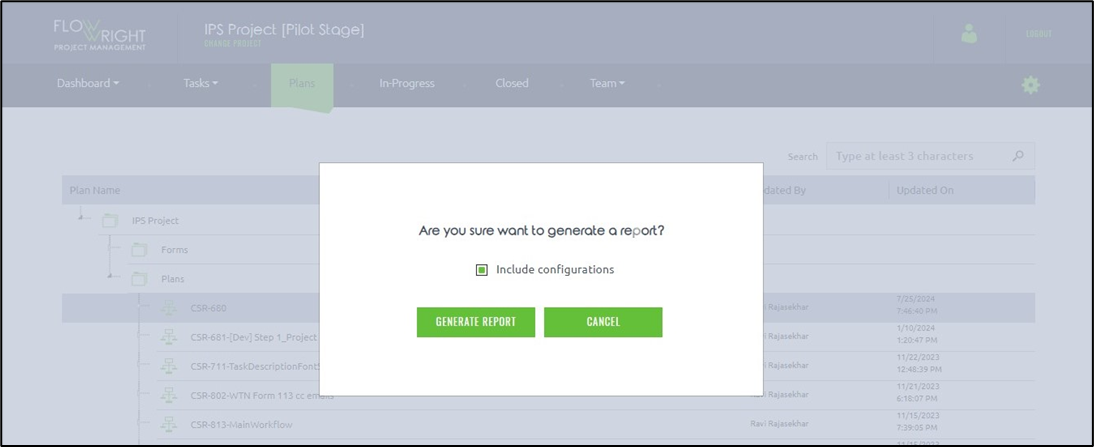
A confirmation popup message is displayed as below. Click the Generate Report button again. You may select the “Include Configurations” checkbox for the report.
The report is rendered on the new page. You may save the report in Excel file format using the Export feature.
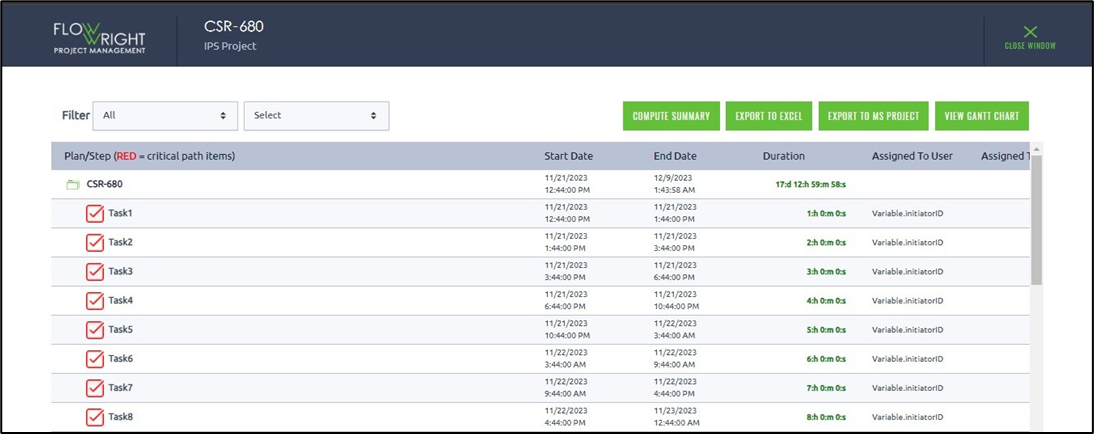
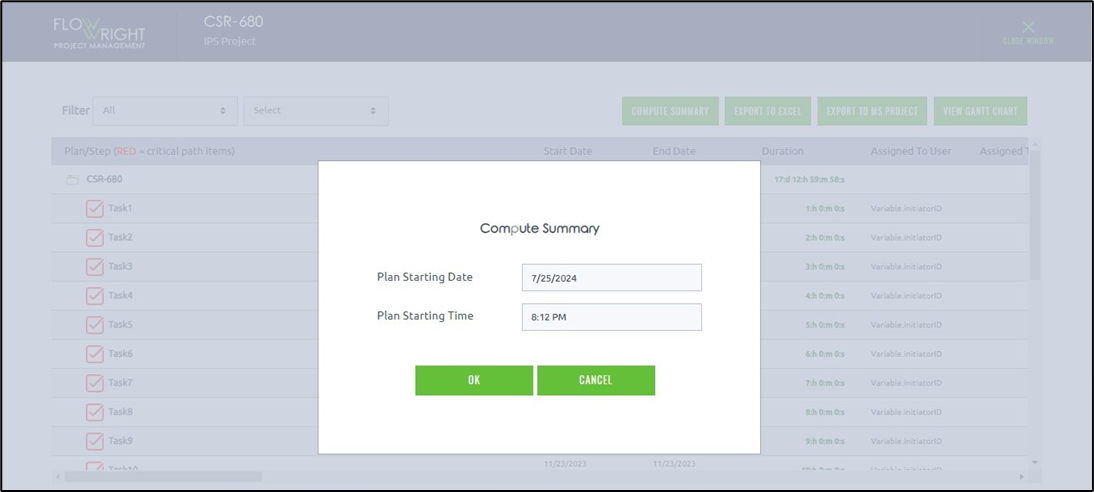
Click the Compute Summary button to recompute the report. You must provide the plan start date and time as below. Click OK to start.
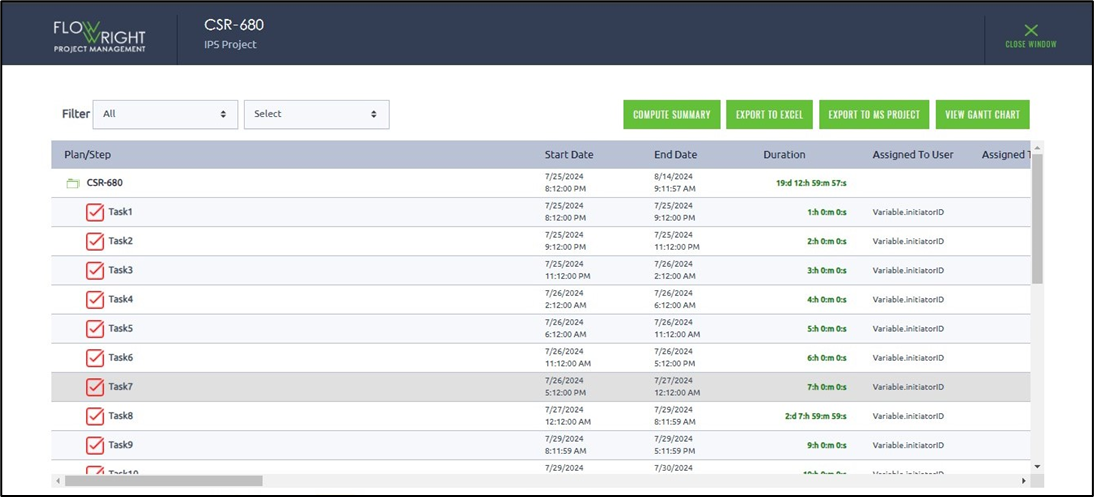
The report is recomputed using the plan date timeline.
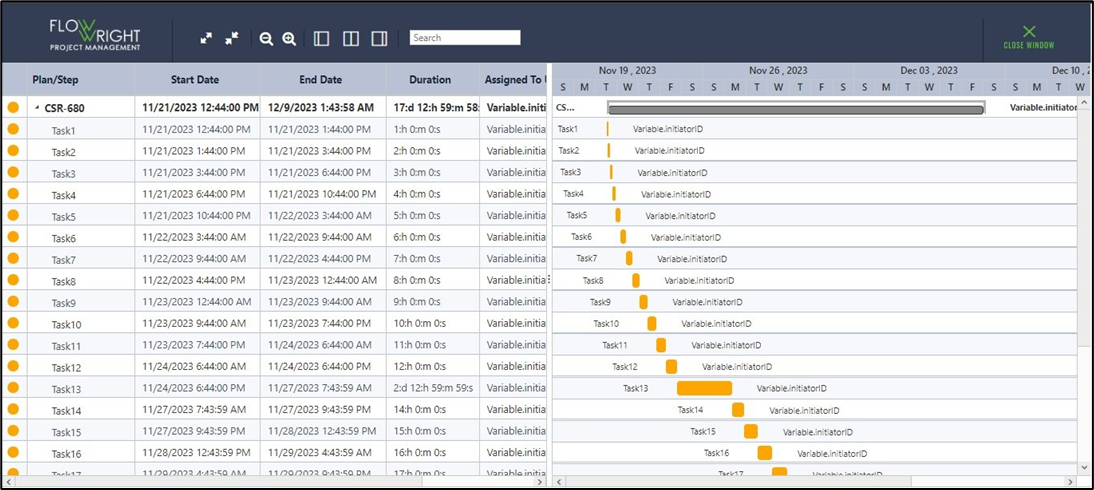
Click the View Gantt Chart button. The report is rendered as below.