You must navigate to the Status> Information> Services menu.
Click the Trigger engine service, and the statistics information shall be rendered in a new tab.

This report is charted using the statistical data (definitions, BI executions, Instance BI executions, and User Connector Executions) of all processes executed in the last 24 hours, with the current date on the X-axis and the number of items processed on the Y-axis.
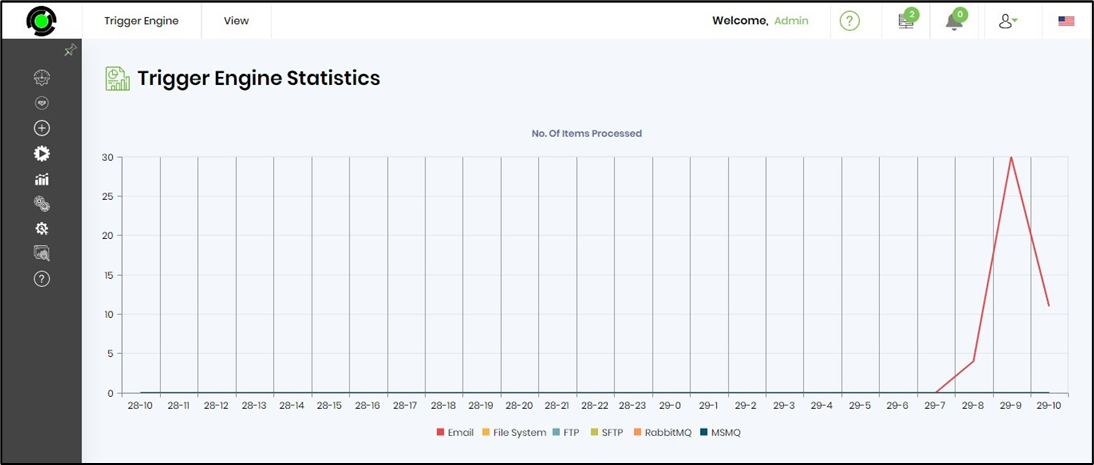
You can view the dataset of the Trigger Engine Service Statistics by hovering your mouse pointer over the graph lines.

Select the View menu to access other services, engine logs, and APIs related to this service.
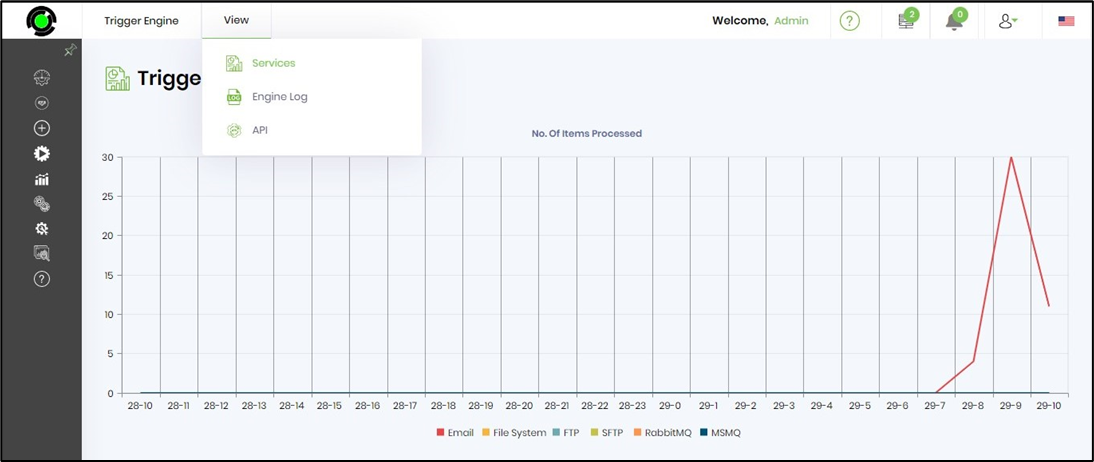
The services menu option navigates back to the Service Status page. The Engine Log menu option displays log data filtered for the last 10 days of activity. The search text box is used to narrow the list to specific records.

You can use the Export menu to download the statistics of your Trigger engine service in any of the formats available to gain more significant insights.

You can use the Clear menu to remove the log records as required.

If you encounter any issues with the Trigger Engine Service Statistics, use the Send to Support menu option to share the log records for further analysis.

Select View - API menu option to view all APIs related to this service.
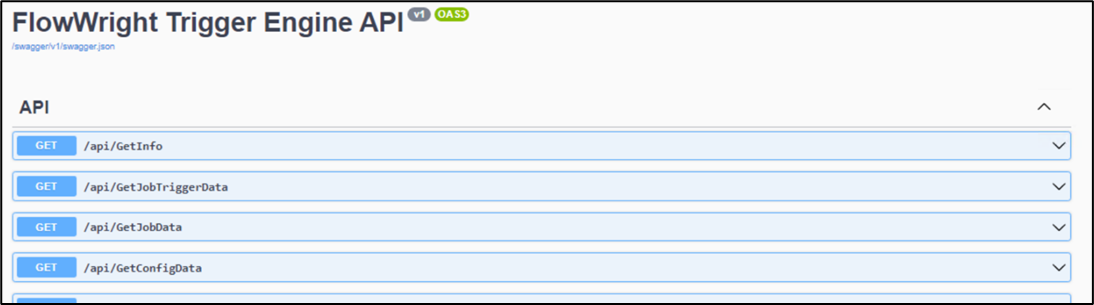
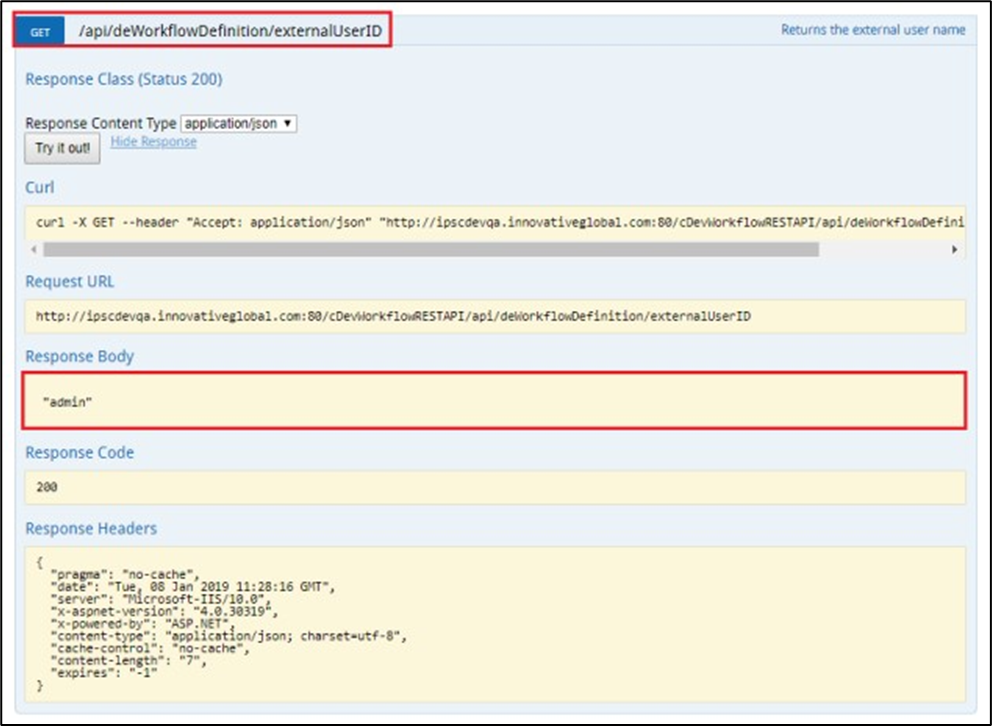
FlowWright provides a REST API, a set of URL routes that allow actions such as POST, GET, PUT, and DELETE to be performed on specific entities within the application. These REST API calls can return their output in JSON format. The REST API can be viewed and tested using the menu item.
Below is an example of how the REST API's “GET externalUserID” call works. Please note that the application URL and port numbers are different in your FlowWright environment.