The built-in report designer efficiently designs report templates. Generated report templates are saved in RDL format, a standard Microsoft report format.
You may create a report template to streamline your design process.
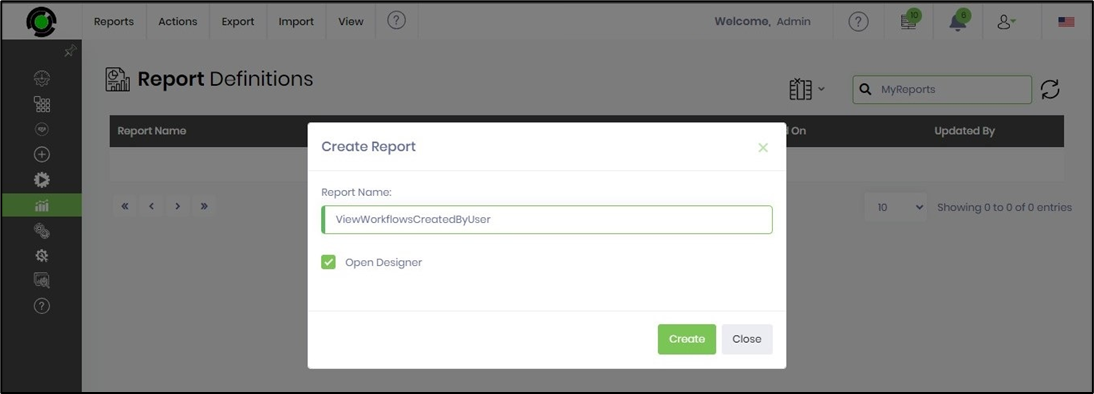
To design a new report, navigate to the Analytics—Reports page and click the Actions—Create menu option. The Create Report popup window will then appear for configuration. You must provide a name for the report and select the checkbox to open the designer when the report is created.
The report template opens in Designer View. The toolbox is arranged on the left pane, the empty canvas is in the center, and the formatting option tools are on the right pane.
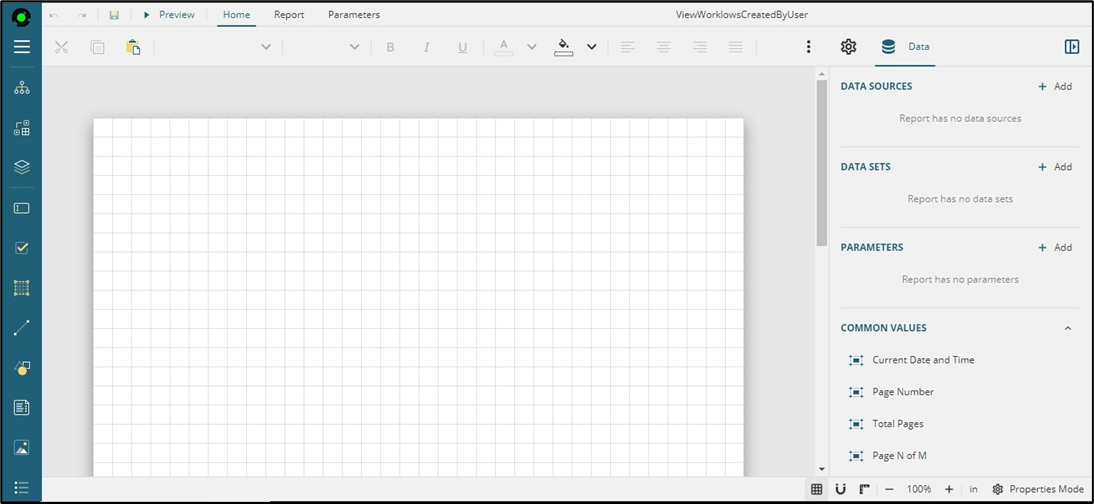
The report is based on data tables and requires configuring a data source and set. First, click the + Add icon to create the data source.
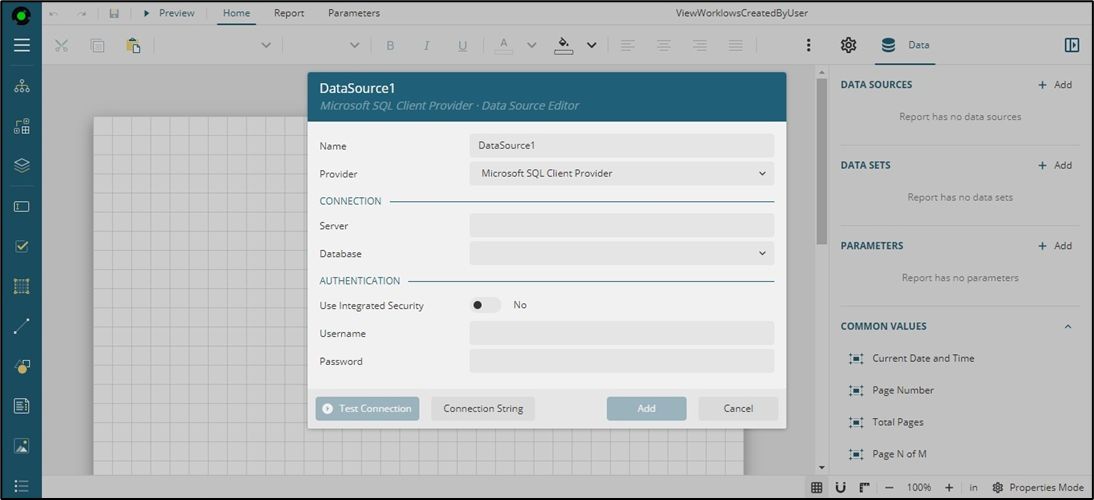
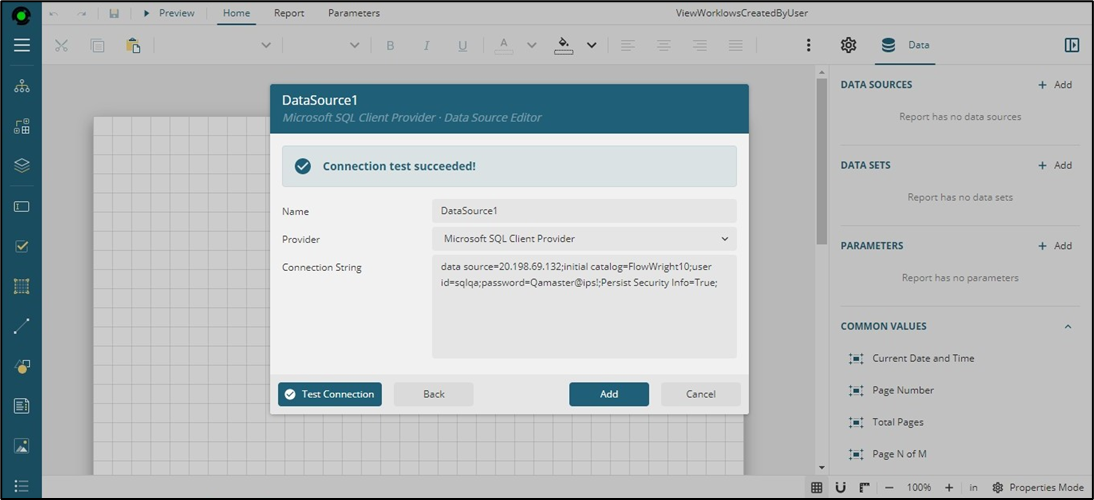
The data source popup window appears next. To access the data, configure the connection and authentication parameters. You may click the Connection String button to provide the regular connection string as input.
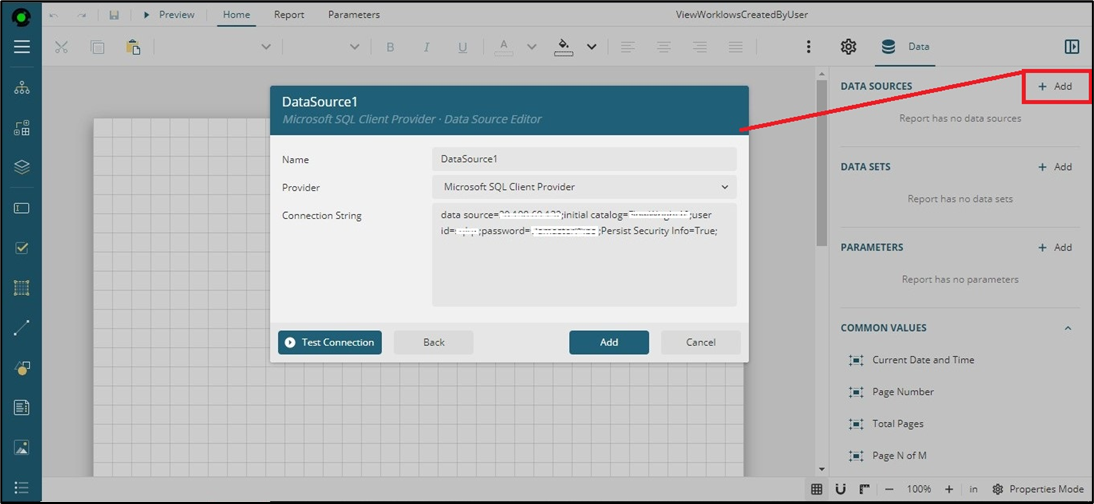
Click on Test Connection to validate the settings and select Add to save the changes.
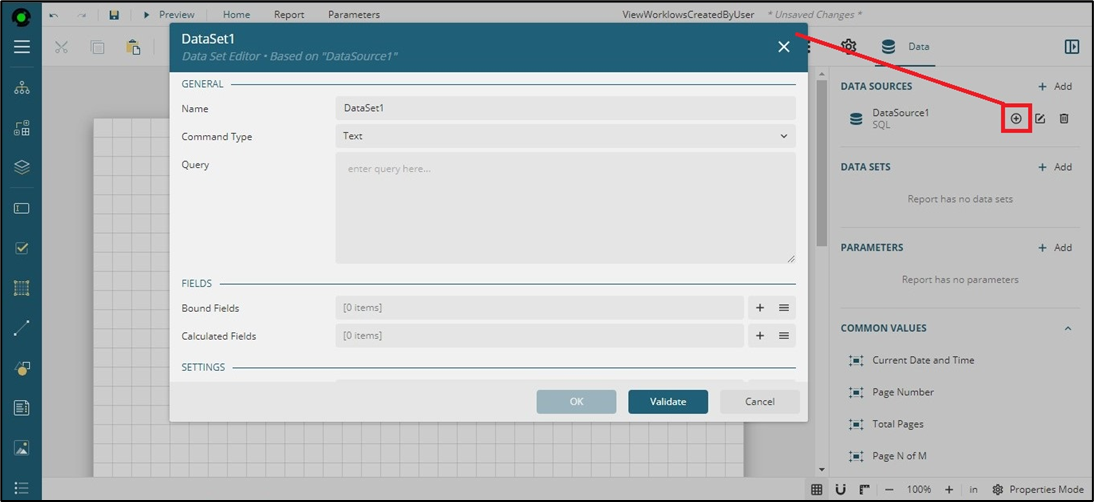
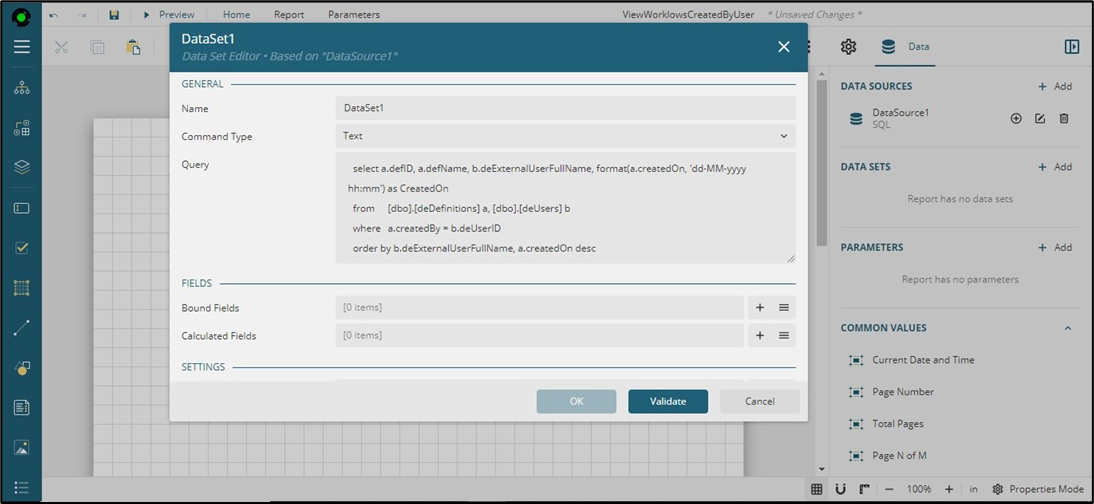
Click on the + (plus) icon to define a data set for your report. The data set popup window is displayed next. Input the SQL query in the box provided.
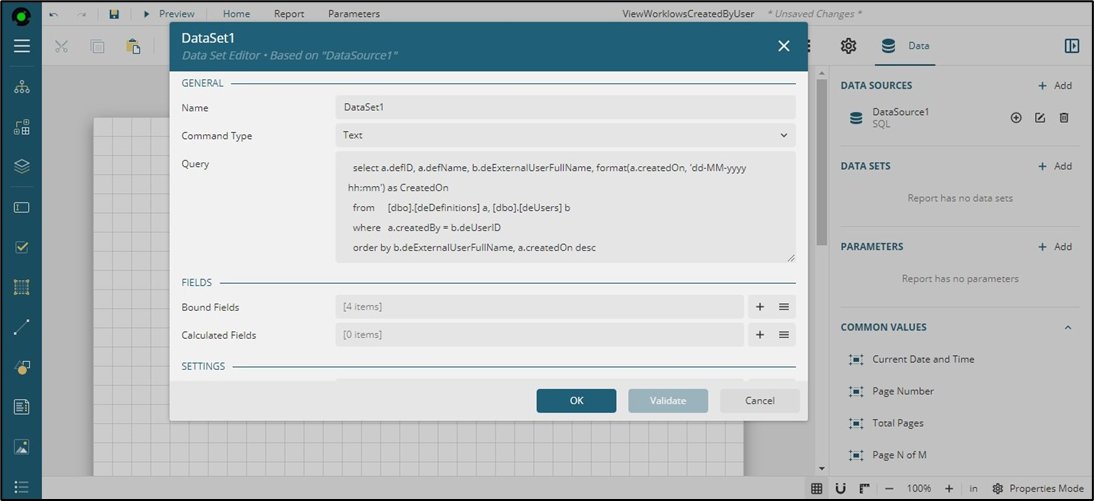
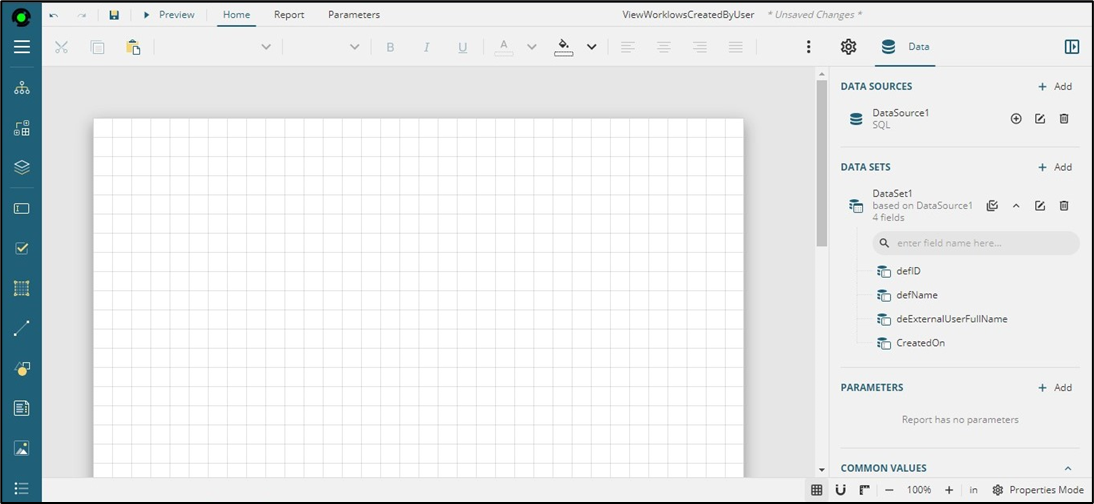
Click on the Validate button to verify the query. Once the query is validated, click the OK button to apply the changes and close the window. The data set is now available to use within the report template.
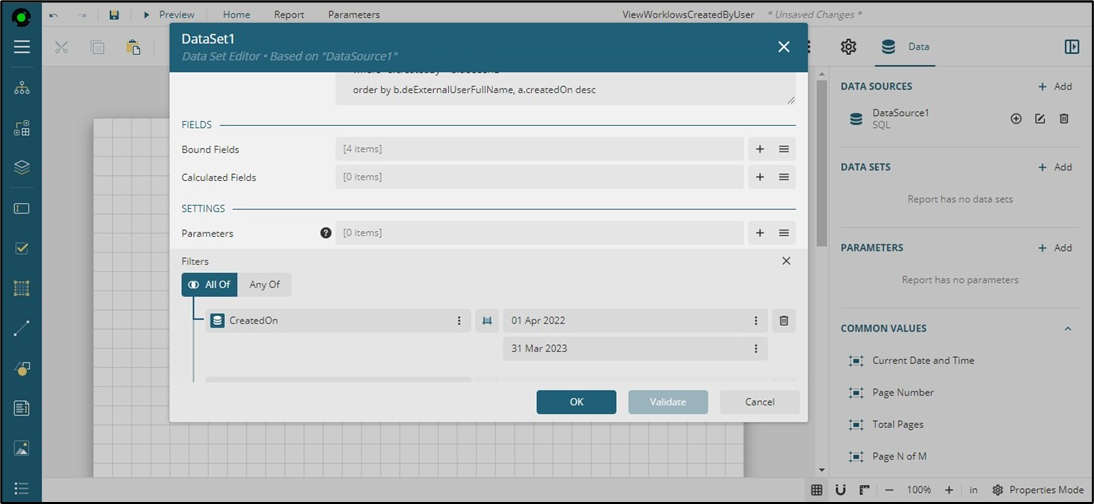
You notice the bound fields indicating the field count available for the report.
You can just configure the filters to narrow the report to the amount you need. Here, the report is configured to filter the result set for a date duration.
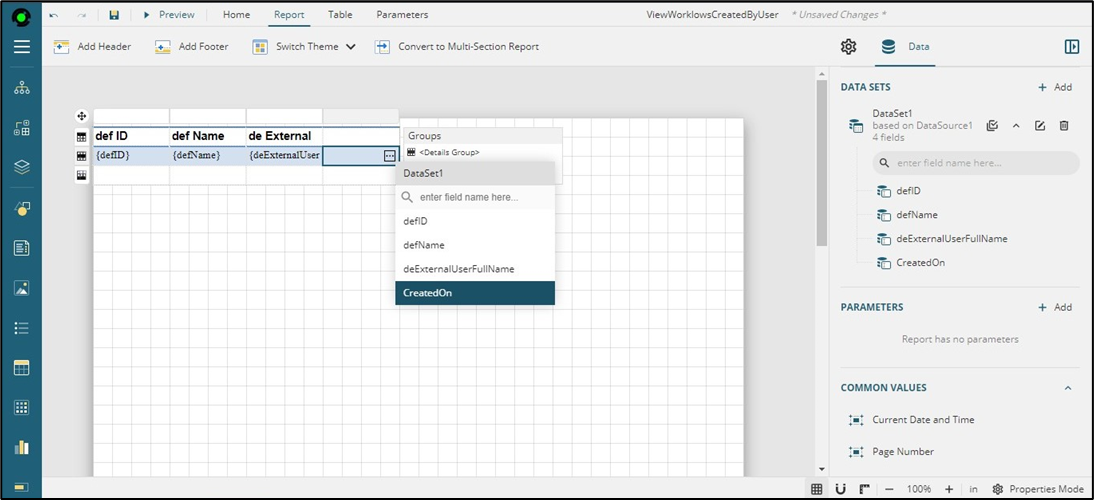
Navigate back to the design canvas. Select the table control from the toolbox and drag it to the top canvas.
Select row#2 and right-click to select the field from the drop-down list. The field is placed in the first column with an appropriate column header text. Continue to arrange the remaining fields as columns in the table. You may be able to drag the column width horizontally to size the information as required.
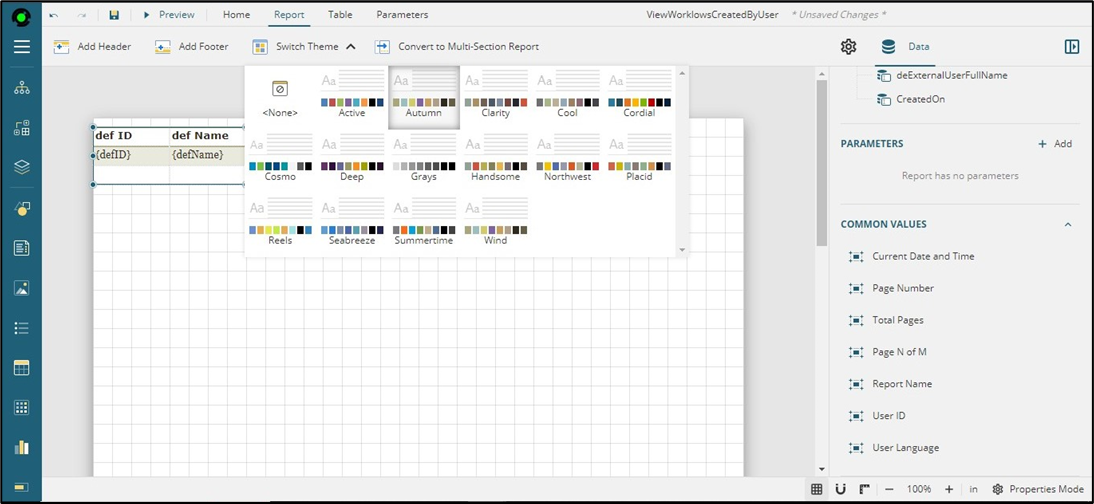
Click on the (+) icon to select the table. Then, navigate to the Switch Theme menu and choose any themes. The design is applied immediately.
Click on the (+) icon to select the table. Then, select the font size required for the report.
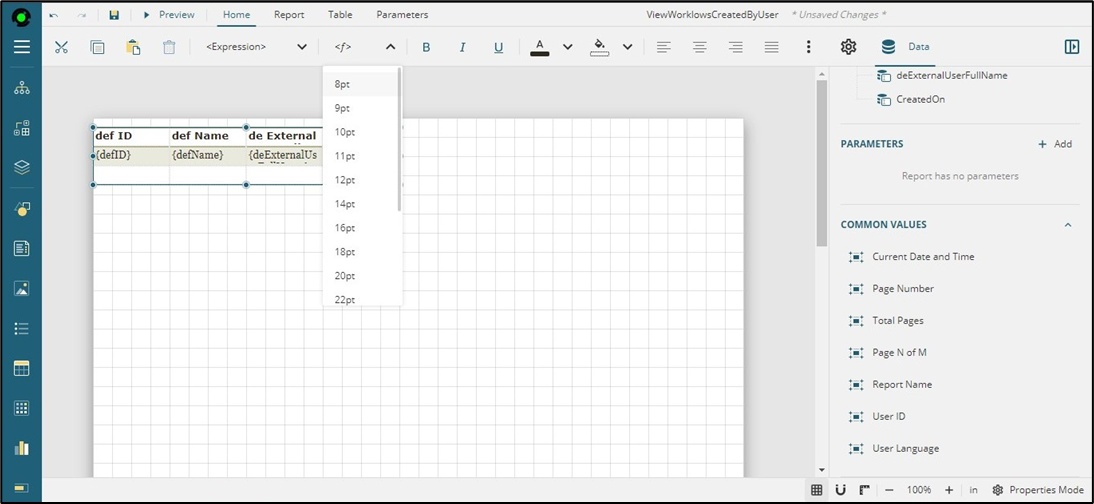
Click on the (+) icon to select the table. Then, choose the font type required for the report.

Click on the Save button to confirm the changes. Click on the Preview button to view the report.
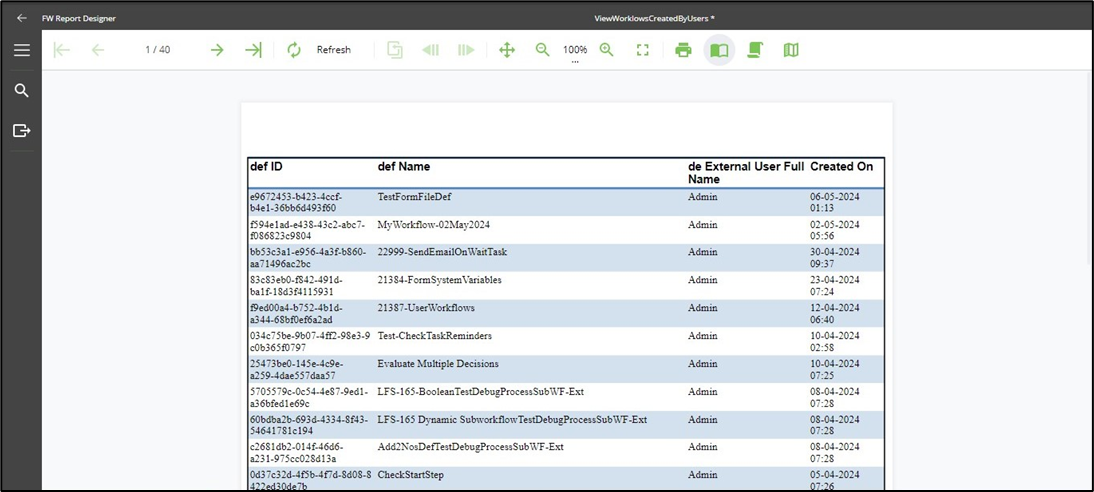
To view the report, navigate to the View - Run Report menu option.

The report is rendered in a new tab, as shown below.
