Displays the plan start/end timing for all task/choice and sub-workflow steps created within the selected definition. The report table shows the plan start date, plan end date, duration, assigned to, and the “Time taken to generate” the definition. This report is generated only for “Task, Choice, Subworkflow” definitions. All dates/times are stored within the database as UTC and displayed based on the user's local timezone.
Note: Engine runtime data are in ISO + UTC format.
“Compute Summary” calculates and highlights critical path steps in the definition, as shown below.
The “Duration” displays the sum of all the “Task, Choice, Subworkflow” based on the order in which they are designed (serial or parallel), as shown below:
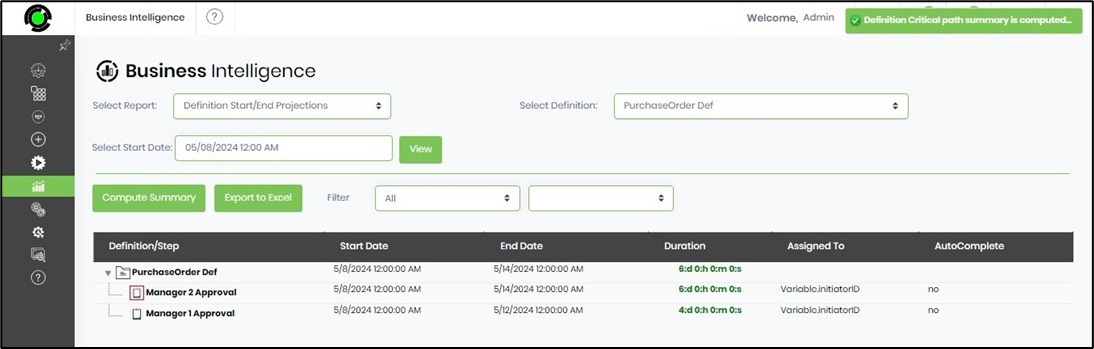
The “Red” task icons display the critical path or the maximum time it takes for each task step to execute the workflow.
A new algorithm for critical path calculation shall now render the definition quicker. The workflow definition project report to XLS now shows Critical Path items. Critical path calculations for definition and instances are based on timezone for steps like milestone and waitForDatetime. When the time zone calculation is null (datediff between get date and getutcdate), the calculation considers the UTC date for a current date for all steps.
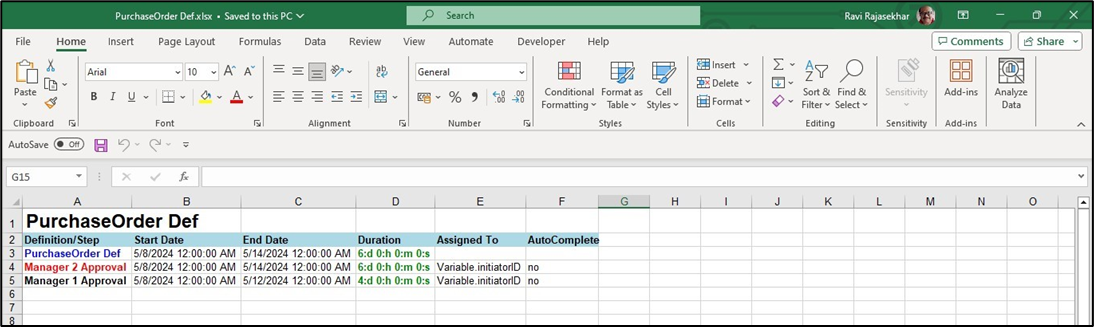
When you click the “Folder” icon, all the tasks expand/collapse, and the “Export as Excel” button allows you to export the selected Definition Projection details into an Excel sheet.
The exported file may look as follows. The critical path items are displayed in red color.
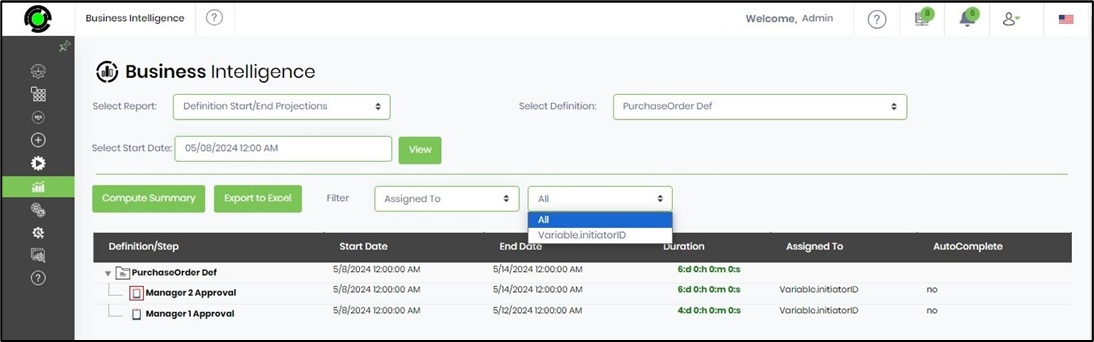
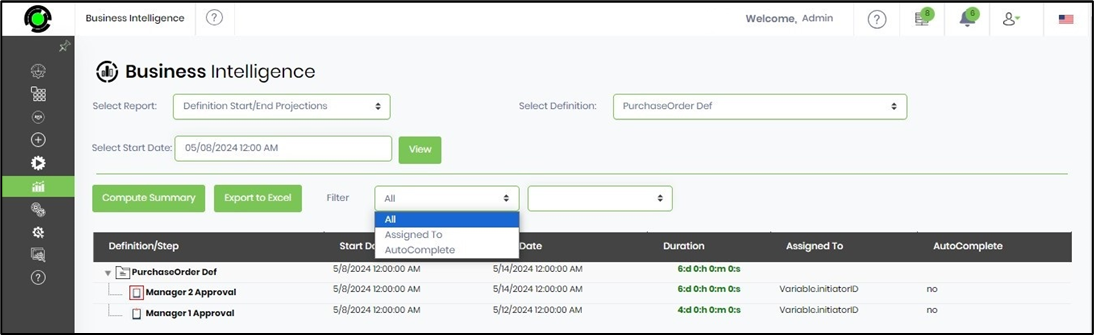
Users can filter the BI report data by clicking the “Filter” drop-down and selecting the desired filter options.
For example, we can view the tasks assigned to various users by selecting the “Assigned To” option and selecting the user name from the adjacent drop-down, as shown below: