This feature helps debug workflows/processes. Debugging workflows, whether in software development, project management, or any other context, involves a systematic approach to identifying and fixing issues that arise during the workflow's execution. Here are steps you can follow to debug the processes effectively.
You can watch the video here to learn more.
Use Debugging Tools: Use tools and techniques appropriate for the workflow environment. This includes the visual debugging features provided by the FlowWright application.
Inspect State and Variables: Check the state of variables and data at various points in the workflow. This can help identify unexpected changes or inconsistencies that may be causing the issue.
Isolate the Issue: Narrow down the scope of the problem to isolate its root cause. This might involve systematically disabling or isolating parts of the workflow to identify which component is causing the issue.
How to start debugging?
There are 2 ways to start debugging.
(1) Select an existing process definition from the table and click on the Actions - Debug menu option.
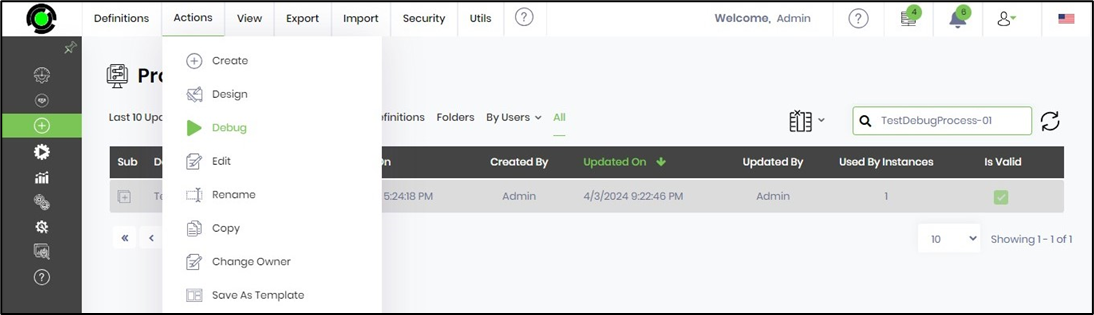
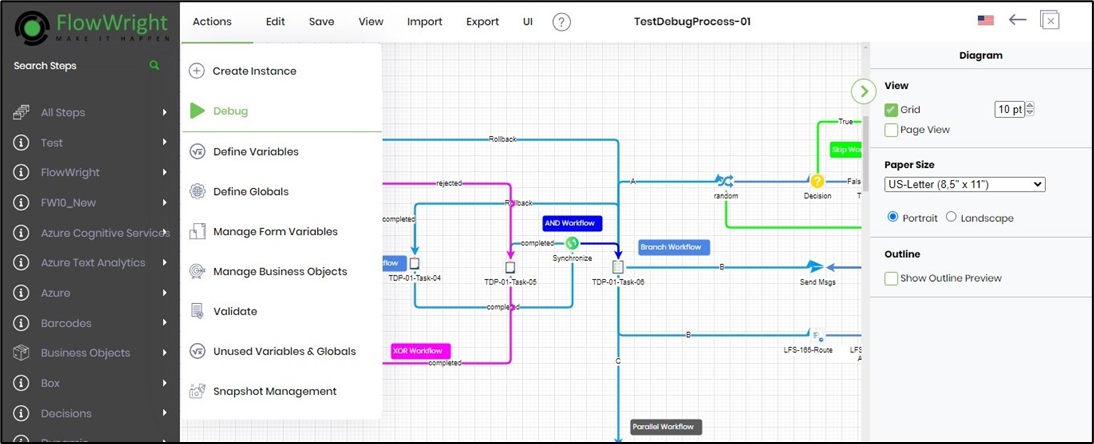
(2) Select an existing process definition from the table and double-click to open the designer page. Then, click on the Actions - Debug menu option.
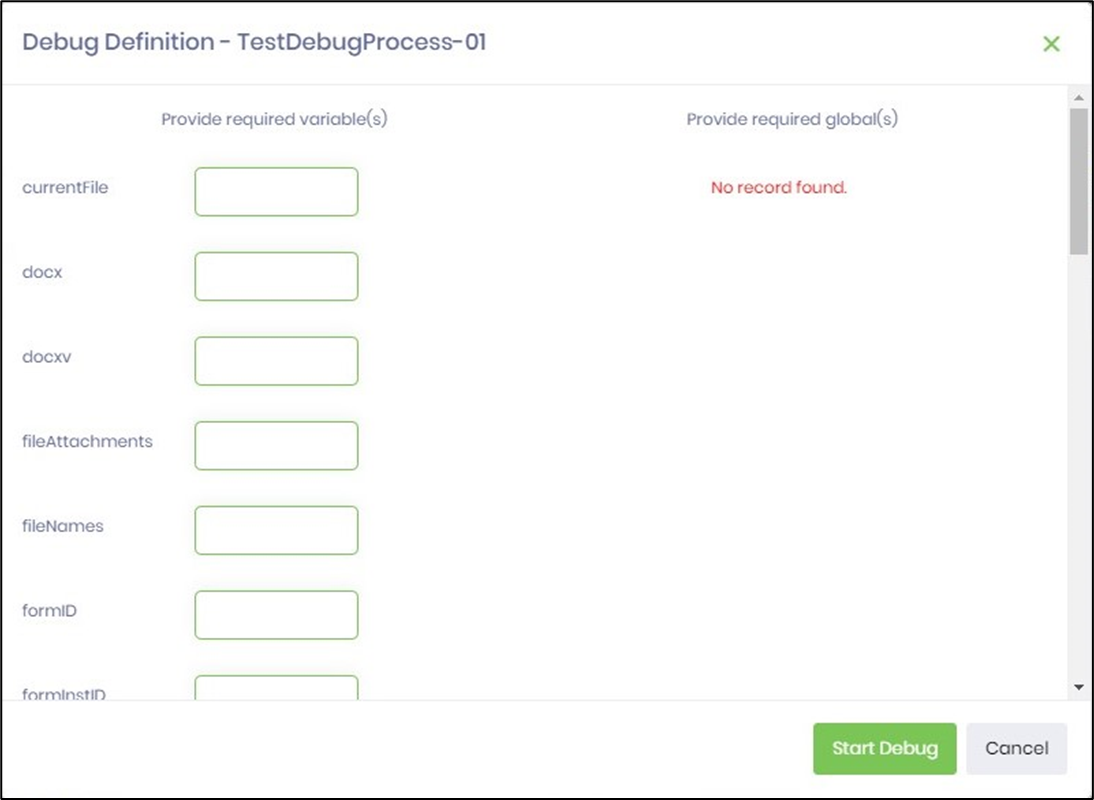
A debug popup window is displayed below. You may provide the values for the variables or globals here. Click on the Start Debug button to initiate the debugging process.
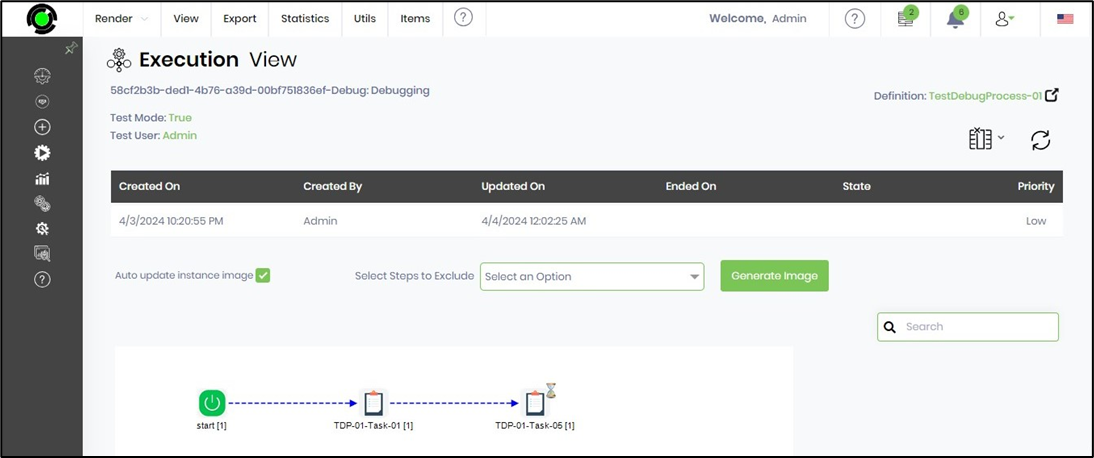
A new process instance is created in the background with the status “Debugging” as shown below.

How do you understand the Visual Debugger UI?
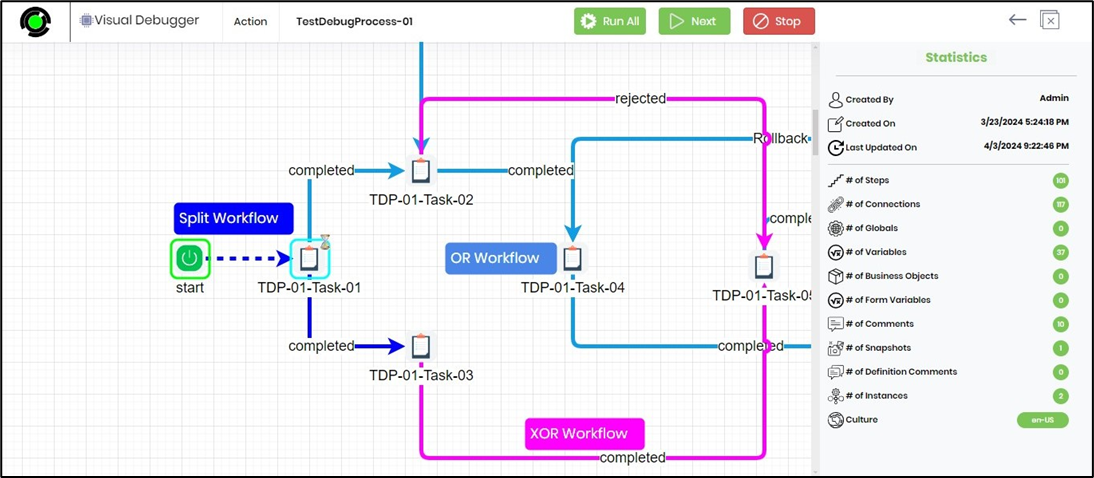
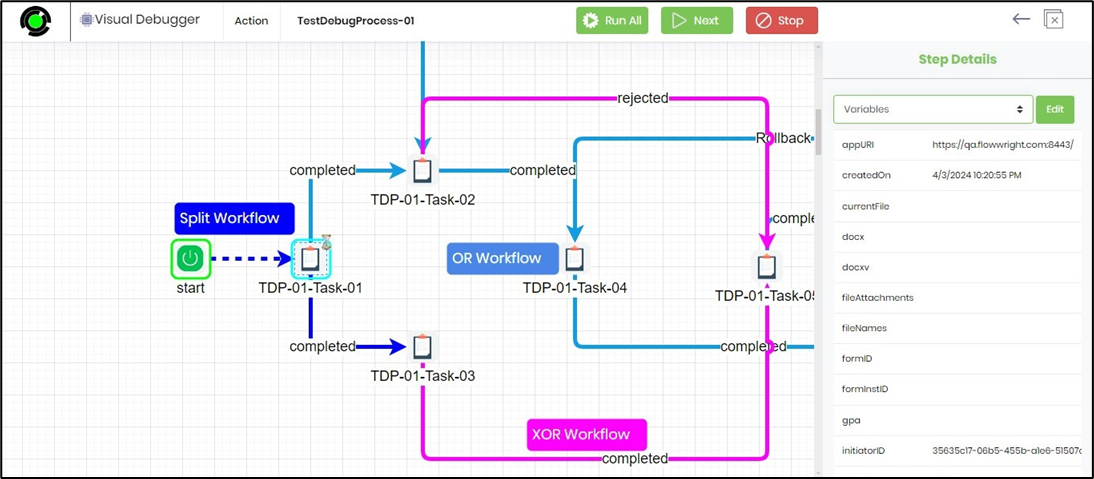
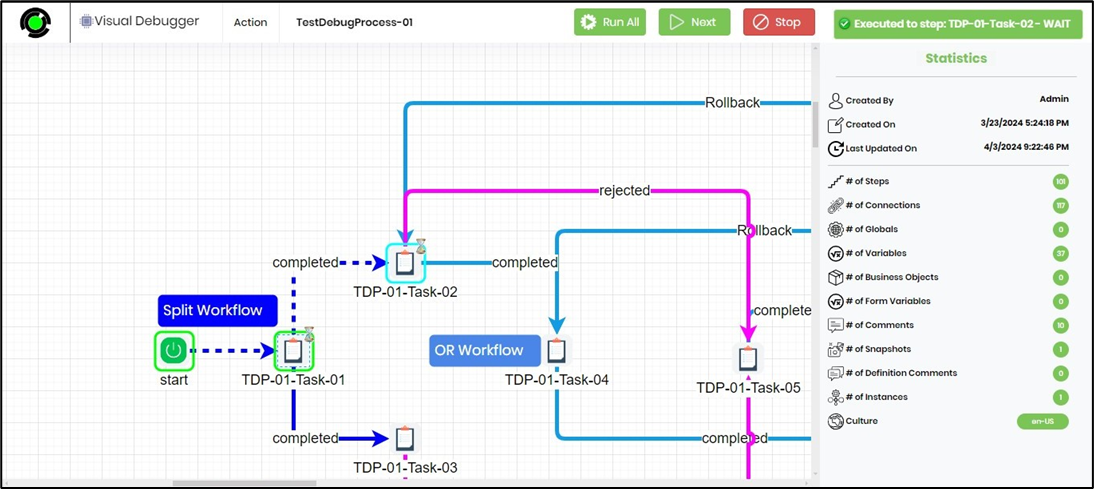
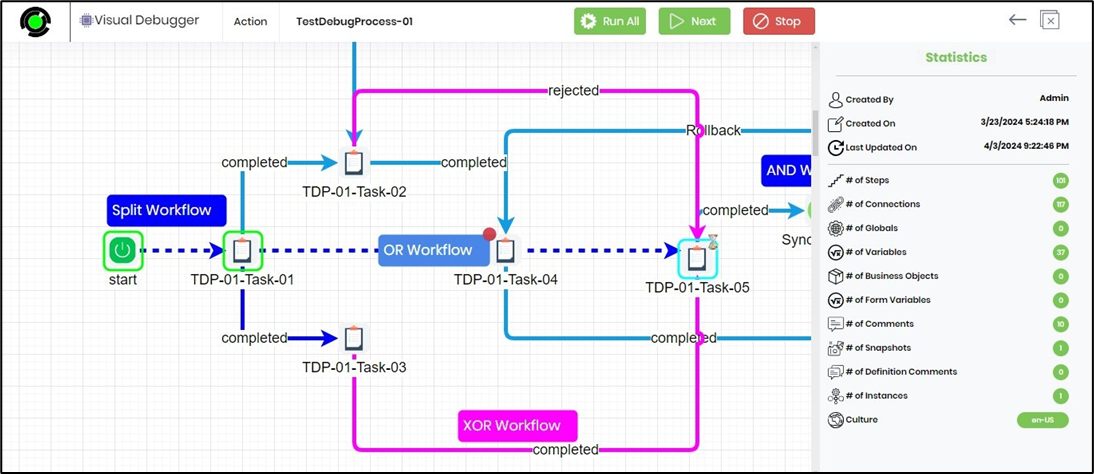
The Visual Debugger UI looks as below. The process workflow is rendered in the center with a green rectangle around the current step. The Statistics window on the right pane shows the definition of the created date and the last modified date. It includes a count of process steps, connections, variables, globals, business objects, form variables, comments, snapshots, definition comments, instances, and definition culture. Use the Next button to navigate to the next step in the workflow. Use the Stop button to stop the debugger. Use the Run All button to execute the process steps and auto-navigate to the breakpoint. Use the (X) button in the upper right corner to close and exit the debugger process. The left arrow ← button opens the process definition page in a new tab.
To examine the step output during the execution, select a process step to view the details in the right pane. A list of variables (both system and process) and their current values are displayed below.
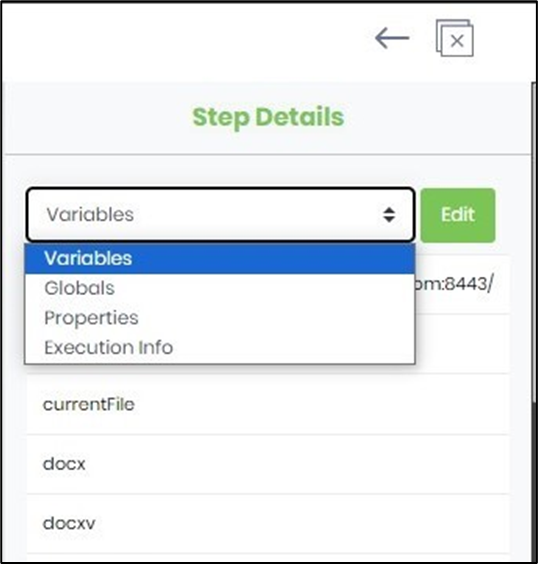
In the Step Details pane, select the dropdown list to choose between Variables, Globals, Properties, or Execution Info, as shown below.
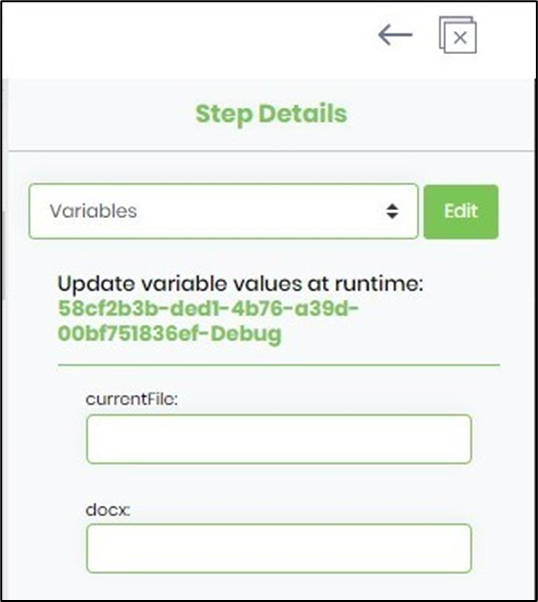
Select Variables and click on the Edit button. You may update the variable values at runtime as shown below. Likewise, the values for Globals and Properties can be modified during runtime.
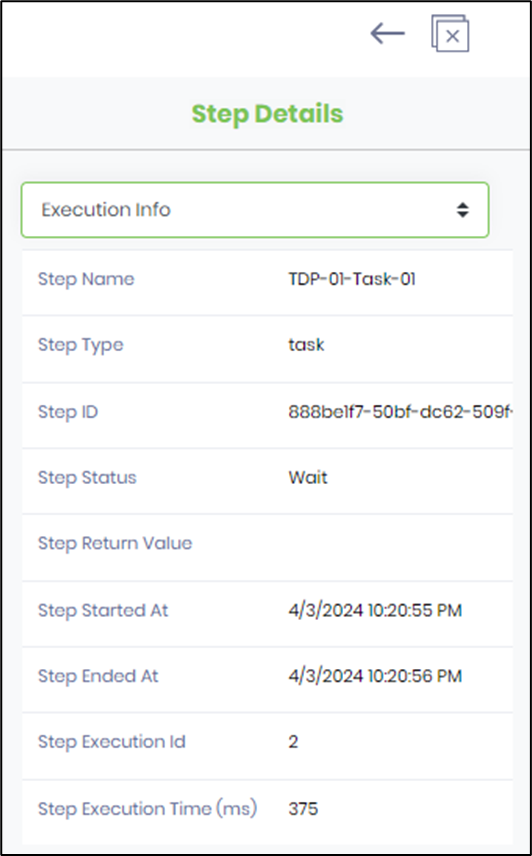
The Execution Info from the dropdown list displays the current step details like name, type, ID, status, return value, start and end date time of the execution, execution ID, and time taken for execution to complete in milliseconds as shown below.
Click anywhere on the debugger canvas to view the Diagram information on the right pane as shown below. You may change the view between Grid and Page View formats by selecting the checkbox. Change the font size using the size dropdown list. Change the paper size and orientation of the workflow to suit the display size when rendered. Select the Outline checkbox and quickly navigate a large workflow by moving and holding down the blue color box across the workflow schematic design.

How do you navigate through the Visual Debugger?
The Visual Debugger UI looks as below. The process workflow is rendered in the center with a green rectangle around the current step. Click on the Next button to execute the current step. The navigation moves to the next step in the workflow and an alert is displayed in the upper right corner as shown below.
If the current step executed is a task step, the task information is rendered automatically in a new tab, as shown below. You may provide the necessary details in the UI and decide to complete, reject, or reassign the task.
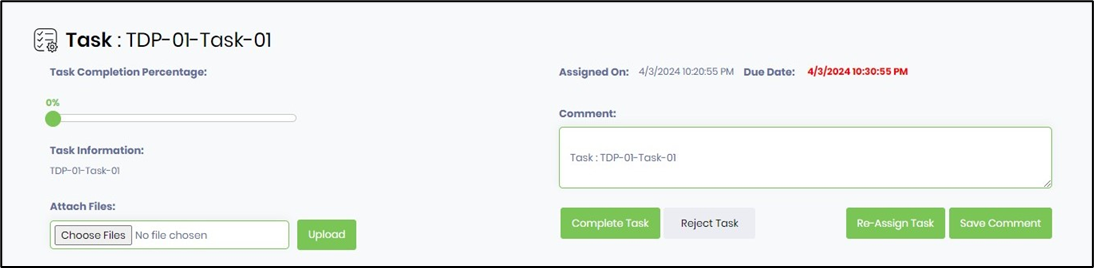
On Task completion, the Visual Debugger navigates to the next step in the sequence.

This approach enables you to thoroughly understand the workflow's intended process and expected outcomes, which will help you identify deviations from the expected behavior.
Let's say, you need to determine the specific issue or problem that needs to be debugged. This might involve unexpected behavior, errors, or failures in the workflow. You need to reproduce the problem consistently. This step is crucial because diagnosing and fixing it might be more challenging if you can't reproduce the issue consistently.
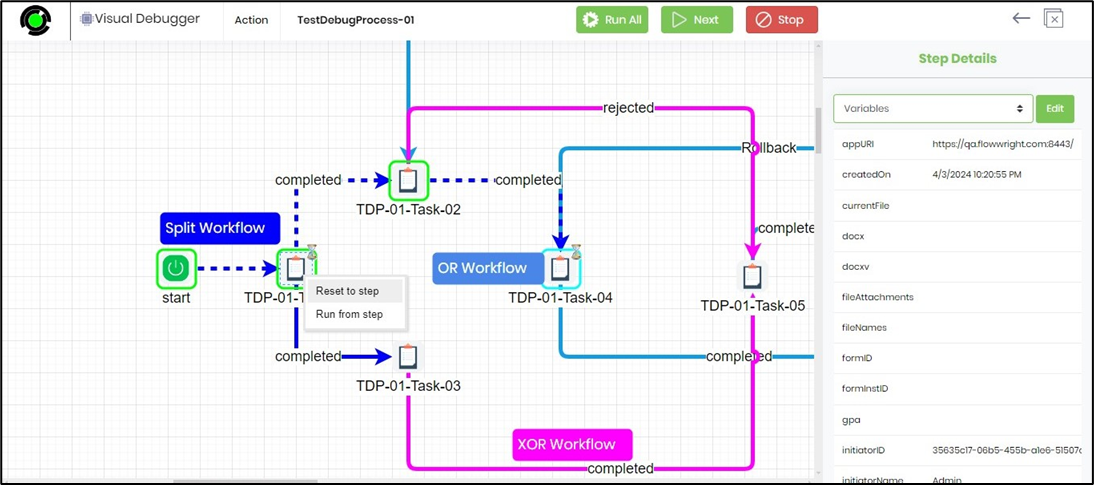
Select the suspected process step on the Visual Debugger canvas and right-click to view the options below. Choose to Reset to step or Run from step option.
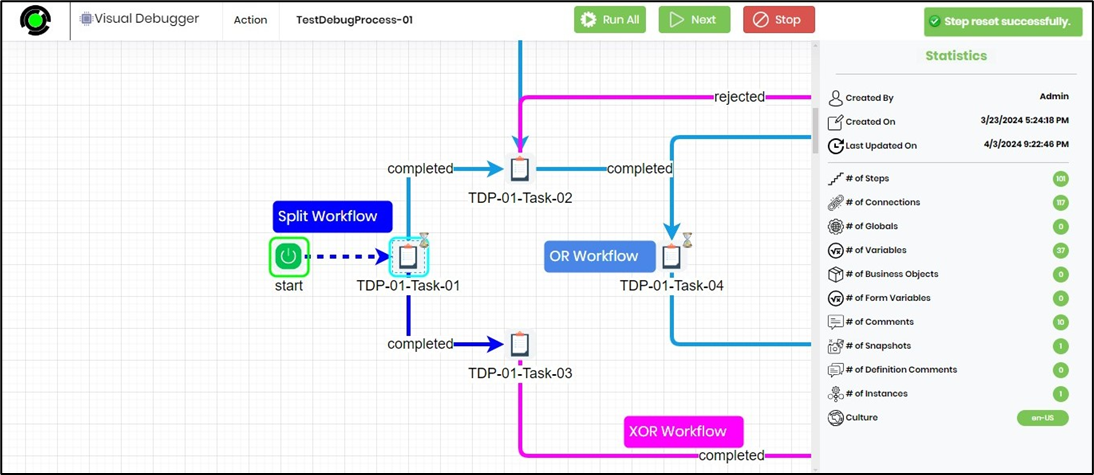
The debugger shall route the process execution accordingly, and an alert notification is displayed in the upper right corner, as shown below.
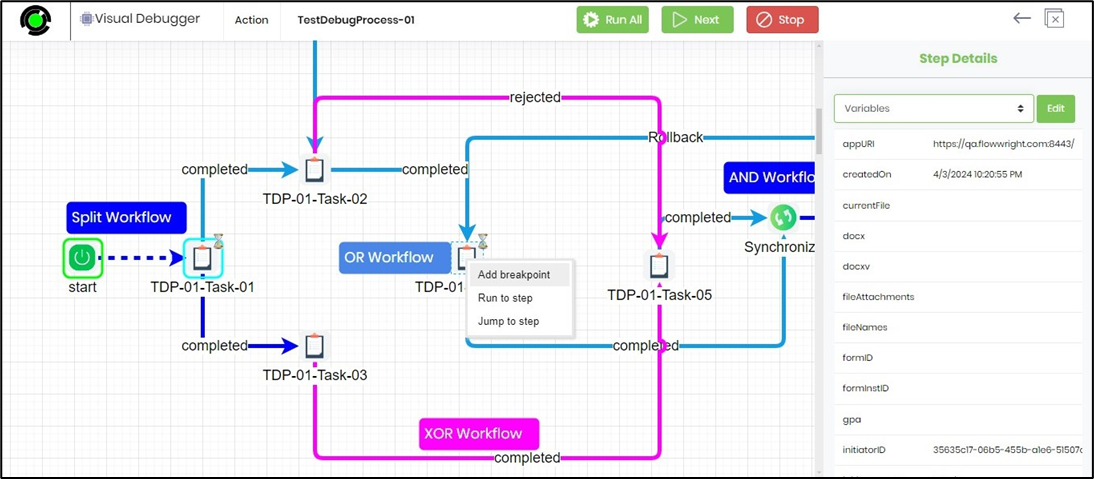
Let's say, you need to add a breakpoint further ahead. Select the process step on the Visual Debugger canvas and right-click to view the options below. Select to add one or many breakpoints this way.
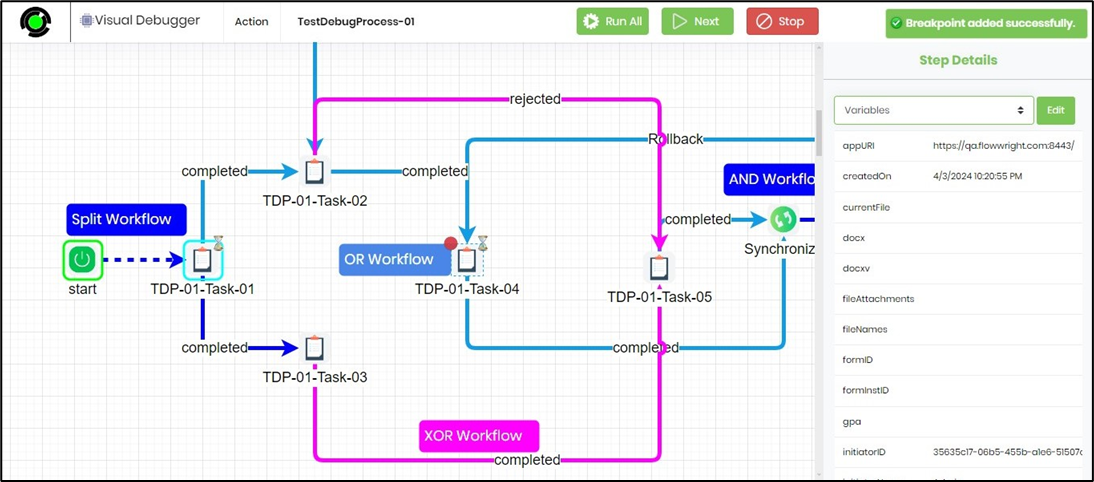
You now identify the breakpoints with a red dot. Click on the Run All button. The debugger will execute all process steps to this breakpoint. Any tasks or forms that require human intervention will be rendered on new pages, which may be completed along the execution path.
Let's say you need to isolate the issue. You may want the debugger process to narrow down the scope of the problem to isolate the root cause. This might involve systematically disabling or isolating parts of the workflow to identify which component is causing the issue. You may use a combination of breakpoints, run-to-step, or jump-to-step options.
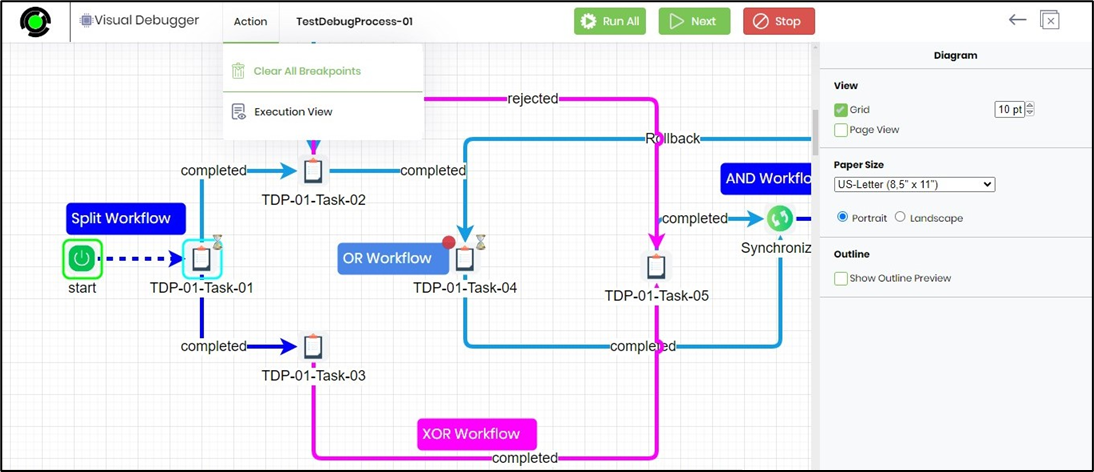
Select Action - Clear All Breakpoints to hasten the debugging execution or configure new breakpoints.
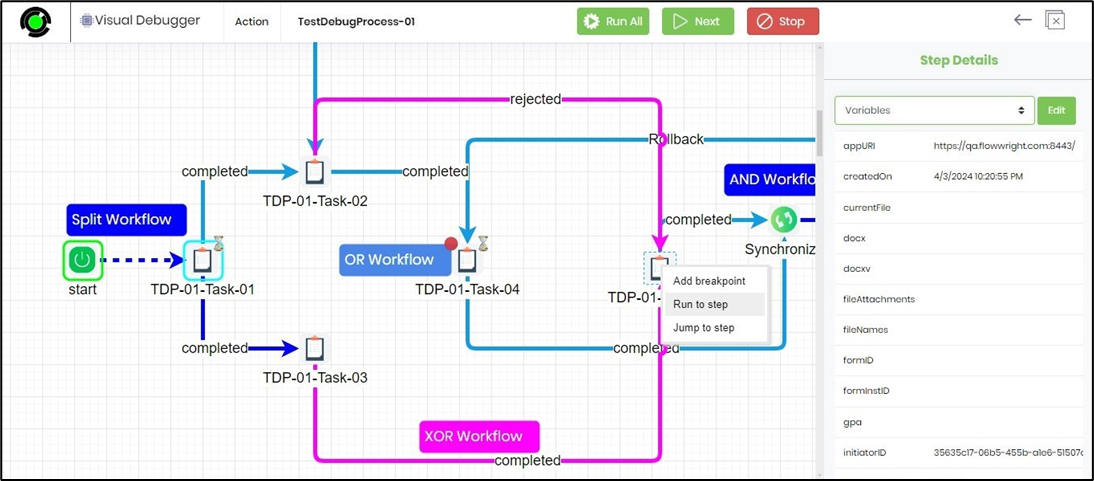
Select the process step on the Visual Debugger canvas and right-click to view the options below. Select the option to Run to step or Jump to step. The debugger shall process the action accordingly.
The Jump to step advances the process execution, as shown below. Click on the Next button. The debugger will execute and navigate forward from this step.
Use the Action—Execution View menu option to understand the process execution up to the current step. This feature is useful when multiple jump-to-step actions are performed during debugging.
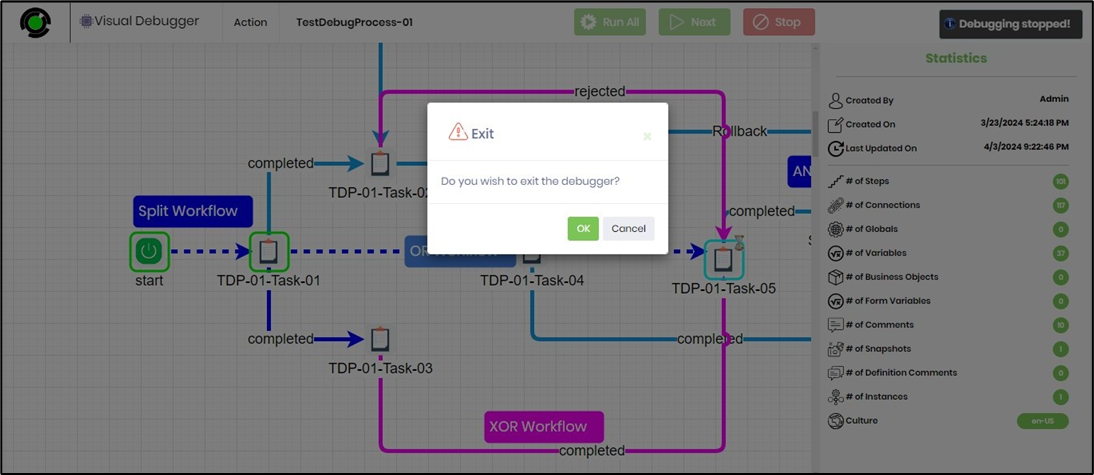
How do you stop the debugging process?
Click the Stop button during the debugging process. An alert notification will appear in the upper right corner. Click the OK button in the popup window to confirm, as shown below.
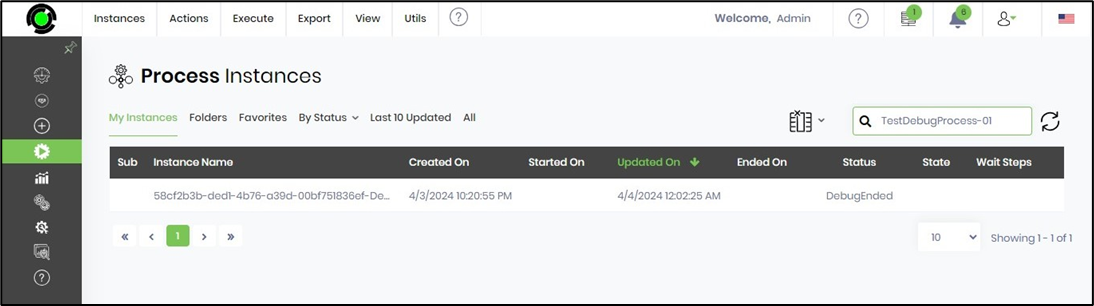
The debug process is stopped, and the process instance status changes to DebugEnded, as shown below.
How do you Visually Debug A Form Process?
You can watch the video here to learn more.